. 2011 Dec 6:7:557.
doi: 10.1038/msb.2011.88.

Temporal competition between differentiation programs determines cell fate choice

Affiliations

Temporal competition between differentiation programs determines cell fate choice

Anna Kuchina et al. Mol Syst Biol. .

Abstract

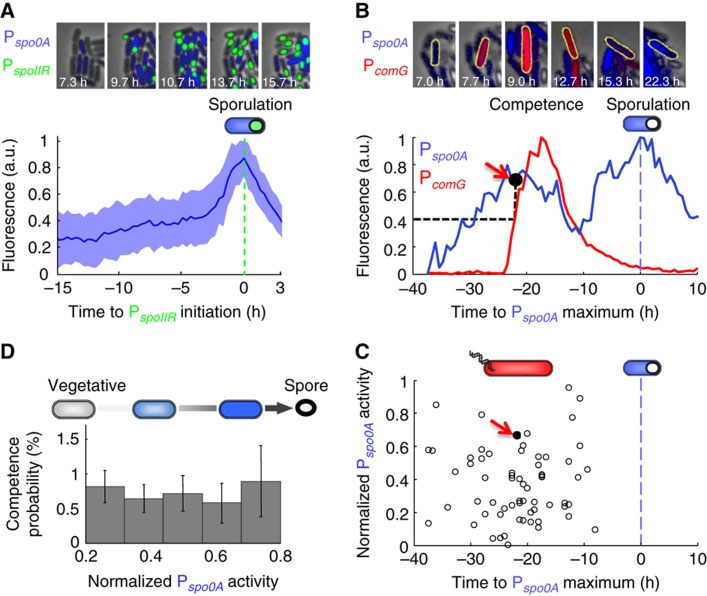
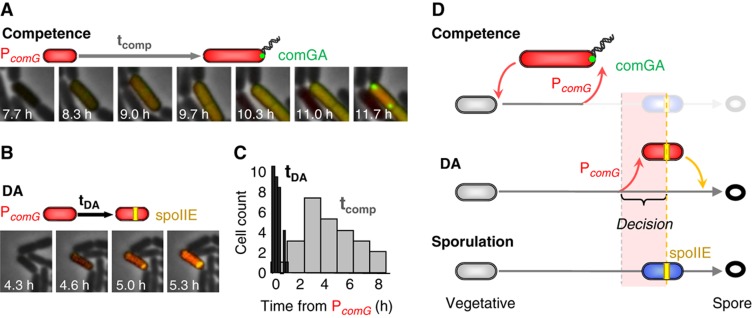
Multipotent differentiation, where cells adopt one of several possible fates, occurs in diverse systems ranging from bacteria to mammals. This decision-making process is driven by multiple differentiation programs that operate simultaneously in the cell. How these programs interact to govern cell fate choice is poorly understood. To investigate this issue, we simultaneously measured activities of the competing sporulation and competence programs in single Bacillus subtilis cells. This approach revealed that these competing differentiation programs progress independently without cross-regulation before the decision point. Cells seem to arrive at a fate choice through differences in the relative timing between the two programs. To test this proposed dynamic mechanism, we altered the relative timing by engineering artificial cross-regulation between the sporulation and competence circuits. Results suggest a simple model that does not require a checkpoint or intricate cross-regulation before cellular decision-making. Rather, cell fate choice appears to be the outcome of a 'molecular race' between differentiation programs that compete in time, providing a simple dynamic mechanism for decision-making.


Conflict of interest statement

The authors declare that they have no conflict of interest.

Figures

Figure 1
Figure 1
Competence initiation during the progression to spore formation. (A) Average fluorescence time trace of sporulating cells from 0A-IIR strain with Pspo0A-YFP (blue) and PspoIIR-CFP (green). Individual traces (n=32) are normalized in amplitude and aligned in time with respect to PspoIIR initiation (60% of peak activity) before averaging. The blue area corresponds to standard deviation. A representative filmstrip of sporulating microcolony of 0A-IIR strain is shown above. For strain definitions, see Supplementary Table S2. We note that the drop of fluorescence signal after the maximum is due to lysis of the mother cell during the spore formation process. (B) Sample quantitative traces illustrating how the activity of sporulation was determined at the initiation of competence. Specifically, the panel shows a single cell (0A-comG strain) undergoing a competence event followed by sporulation. Competence reporter PcomG activity is measured by CFP fluorescence intensity (shown in red) and Pspo0A activity is measured by YFP fluorescence intensity (in blue). The competence and sporulation events are highlighted by the cartoon and the filmstrip on top. The traces are aligned in time with respect to maximum Pspo0A activity at sporulation (set as zero time point). These data are utilized to determine Pspo0A activity (black circle highlighted by red arrow) at initiation of competence (defined by >30% PcomG activity relative to maximum PcomG amplitude at competence). For comparison, both time traces are normalized with respect to amplitude. (C) Pspo0A activity (black circles) at initiation of competence measured in single cells, n=67, from 0A-comG strain, as shown in (B). The filled circle highlighted by red arrow corresponds to the measurement shown in (B). The traces are aligned with respect to maximum Pspo0A activity at sporulation as described in (B). (D) Conditional probability of competence as a function of normalized Pspo0A activity. Pspo0A expression at onset of competence was measured in single cells from the 0A-comG strain as shown in (B) and (C). Conditional probability of competence is calculated as the number of competence initiations observed at specified values of Pspo0A expression normalized by the number of total surrounding cells with the specified Pspo0A amplitude (Supplementary Figure S1; Supplementary information, S2.4.3). Only data for Pspo0A activities between 20 and 80% are shown, because data <20% is within error and cells >80% are too close to spore formation ((A)). Error bars represent counting error.
Figure 2
Figure 2
Cross-regulation genes expression in single cells displays a cell fate-specific pattern only after cell fate choice. Panels (A) and (B) show mean PabrB-YFP (A) and PsinI-YFP (B) fluorescence measured in single cells of strains 0A-comG-abrB (n=10 competent and 40 spores), and 0A-comG-sinI (n=10 competent and 25 spores), respectively. The fluorescence measurements were taken from time points either 40 min before initiation of respective cell fate reporter (30% of maximum value for PcomG, 90% of maximum value for Pspo0A), labeled ‘pre-decision’, or 40 min after the maximum expression of respective cell fate reporter, labeled ‘execution’. Error bars represent standard error of the mean (s.e.m.). *P<0.001.
Figure 3
Figure 3
Cells identified in the DA state suggest lack of cross-regulation before cell fate decision. (A) Filmstrip of a representative competent cell visualized by competence reporter PcomG-CFP (red) (see also Supplementary Figure S6A). (B) Filmstrip of a representative DA cell expressing the same reporter (PcomG-CFP) as shown in (A) (see also Supplementary Figure S6B). (C) Sample time traces illustrating how the activity of sporulation was determined specifically in DA cells. The panel shows a single DA cell (0A-comG strain), in which PcomG activity is measured by CFP fluorescence intensity (shown in red) and Pspo0A activity is measured by YFP fluorescence intensity (in blue). The traces are aligned in time with respect to maximum Pspo0A activity at sporulation (set as zero time point). There data are utilized to determine Pspo0A activity (red circle) at initiation of PcomG expression in DA cells (defined by >30% PcomG activity relative to maximum observed PcomG amplitude), similarly to Figure 1B. For comparison, both time traces are normalized with respect to amplitude. (D) Pspo0A activity measured in single DA cells (red circles), n=67. The data were combined from measurements of 0A-comG, [0A-comG]0AK, [0A-comG]IIGK strains (see Supplementary Figure S8 and the manuscript below). The traces are aligned with respect to maximum Pspo0A activity at sporulation as described in (C). Pspo0A activity at the onset of competence (black circles) determined in Figure 1C is shown for comparison. For strain definitions, see Supplementary Table S2. (E) Average time traces of single DA cells measured in strains containing pairwise combinations of each of the indicated sporulation reporters together with PcomG-CFP; strains are as follows: 0A-comG (n=15), IIE-comG (n=7), IIG-comG (n=13), IIR-comG (n=4). All traces are normalized in amplitude and aligned in time with respect to PcomG activity (30% of peak activity). See also Supplementary Figure S8A. (F) Left: The design of the NoE strain. An E. coli protease tag ssrA was translationally fused to SpoIIE protein, and a specific E. coli protease factor SspB that targets this tag for degradation was expressed from PcomG promoter. Simultaneous activation of both differentiation programs, a characteristic of DA state, in engineered NoE cells would result in targeted degradation of SpoIIE. For details, see Supplementary information, S2.3. Right: Competent and DA cell frequencies observed in a strain lacking the NoE modification (‘No protease’) compared with the NoE strain. Black bars show competent cells fraction, while red bars indicate DA cells fraction. Both strains have enhanced background DA frequency for easier analysis as a result of ectopic ComK expression from PspoIIG promoter (see Figure 5 and Supplementary Table S1). Error bars represent standard error of the mean (s.e.m.).
Figure 4
Figure 4
Temporal competition between differentiation programs determines cell fate. (A) Filmstrip showing a typical competent cell from the strain expressing PcomG-CFP (red) and ComGA-YFP protein fusion (green). Time between PcomG initiation (>30% maximum) and ComGA localization to cell poles (11.7 h) is indicated as tcomp. (B) Filmstrip of a representative DA cell visualized by PcomG-CFP (red) and SpoIIE-YFP (orange). Time between PcomG initiation (>30% maximum) and SpoIIE localization to asymmetric septum (>40% maximum, 5.3 h) is indicated as tDA. (C) Histogram of time between PcomG initiation defined as in (A) (set as zero time point) and either ComGA localization to cell poles in competent cells (tcomp, n=27), or SpoIIE localization to asymmetric septum in DA cells (tDA, n=32) measured in single cells as described in (A) and (B). (D) Diagram of the ‘molecular race’ hypothesis. Competence (top panel) occurs if ComK expression begins early enough to give sufficient time for ComGA localization (green dot) before SpoIIE (yellow line). However, functional competence cannot develop if ComK is expressed within the critical time window (termed ‘Decision’ and shown in pink) close to SpoIIE localization, resulting in DA state where sporulation takes over (middle panel). Sporulation is shown in the bottom panel for reference.
Figure 5
Figure 5
Perturbation of timing between sporulation and competence changes cell fate outcome. (A) Engineered cross-regulatory links between sporulation and competence circuits designed to test the ‘molecular race’ hypothesis. Top panel, comK is ectopically expressed either from the early stage of sporulation (Pspo0A promoter) before the decision time window discussed in Figure 4D (‘Decision’, pink area), the later stage close in time to decision (PspoIIG promoter) or past the decision window (PspoIIR promoter). Middle panel, two independent copies of comK gene are ectopically expressed from the indicated promoters (Pspo0A and PspoIIG). Bottom panel, yneA is ectopically expressed together with comK from either early (Pspo0A) or later (PspoIIG) stage of sporulation. (B) Competence and DA fractions measured in the strains expressing yneA and/or comK from early and late stage-specific sporulation promoters as described in (A). All strains are also expressing PcomG-CFP to report ComK activity. Each dot indicates the labeled specific strain. ‘Native’ denotes the PY79 B. subtilis strain expressing only the PcomG reporter. ‘Before’ and ‘During’ expression corresponds to ectopic expression from Pspo0A and PspoIIG promoters, respectively, as shown in (A). Red arrows indicate comK expression. Green arrows point to strains expressing two copies of Pspo0A-comK (‘2 × before’) and PspoIIG-comK (‘2 × during’) denoted ‘2 × Pspo0A-comK’ and ‘2 × PspoIIG-comK’, respectively. Blue arrows show yneA expression from either Pspo0A or PspoIIG promoter, termed ‘before+delay’ and ‘during+delay’, respectively. Detailed statistics for all strains can be found in Supplementary Table S1. Error bars represent standard deviation.

Comment in

Similar articles

Cited by

References

    1. Arigoni F, Duncan L, Alper S, Losick R, Stragier P (1996) SpoIIE governs the phosphorylation state of a protein regulating transcription factor sigma F during sporulation in Bacillus subtilis. Proc Natl Acad Sci USA 93: 3238–3242 - PMC - PubMed
    1. Asayama M, Kobayashi Y (1993) Signal transduction and sporulation in Bacillus subtilis: heterologous phosphorylation of Spo0A, a sporulation initiation gene product. J Biochem 114: 385–388 - PubMed
    1. Bai U, Mandic-Mulec I, Smith I (1993) SinI modulates the activity of SinR, a developmental switch protein of Bacillus subtilis, by protein-protein interaction. Genes Dev 7: 139–148 - PubMed
    1. Balazsi G, van Oudenaarden A, Collins JJ (2011) Cellular decision making and biological noise: from microbes to mammals. Cell 144: 910–925 - PMC - PubMed
    1. Banse AV, Chastanet A, Rahn-Lee L, Hobbs EC, Losick R (2008) Parallel pathways of repression and antirepression governing the transition to stationary phase in Bacillus subtilis. Proc Natl Acad Sci USA 105: 15547–15552 - PMC - PubMed

Publication types