

Mycolic acids as diagnostic markers for tuberculosis case detection in humans and drug efficacy in mice
- PMID: 22147526
- PMCID: PMC3376831
- DOI: 10.1002/emmm.201100185
Mycolic acids as diagnostic markers for tuberculosis case detection in humans and drug efficacy in mice
Abstract
Mycolic acids are attractive diagnostic markers for tuberculosis (TB) infection because they are bacteria-derived, contain information about bacterial species, modulate host-pathogen interactions and are chemically inert. Here, we present a novel approach based on mass spectrometry. Quantification of specific precursor → fragment transitions of approximately 2000 individual mycolic acids (MAs) resulted in high analytical sensitivity and specificity. We next used this tool in a retrospective case-control study of patients with pulmonary TB with varying disease burdens from South Korea, Vietnam, Uganda and South Africa. MAs were extracted from small volume sputum (200 µl) and analysed without the requirement for derivatization. Infected patients (70, 19 of whom were HIV+) could be separated from controls (40, 20 of whom were HIV+) with a sensitivity and specificity of 94 and 93%, respectively. Furthermore, we quantified MA species in lung tissue of TB-infected mice and demonstrated effective clearance of MA levels following curative rifampicin treatment. Thus, our results demonstrate for the first time the feasibility and clinical relevance of direct detection of mycobacterial lipids as biomarkers of TB infection.
Copyright © 2012 EMBO Molecular Medicine.
Figures
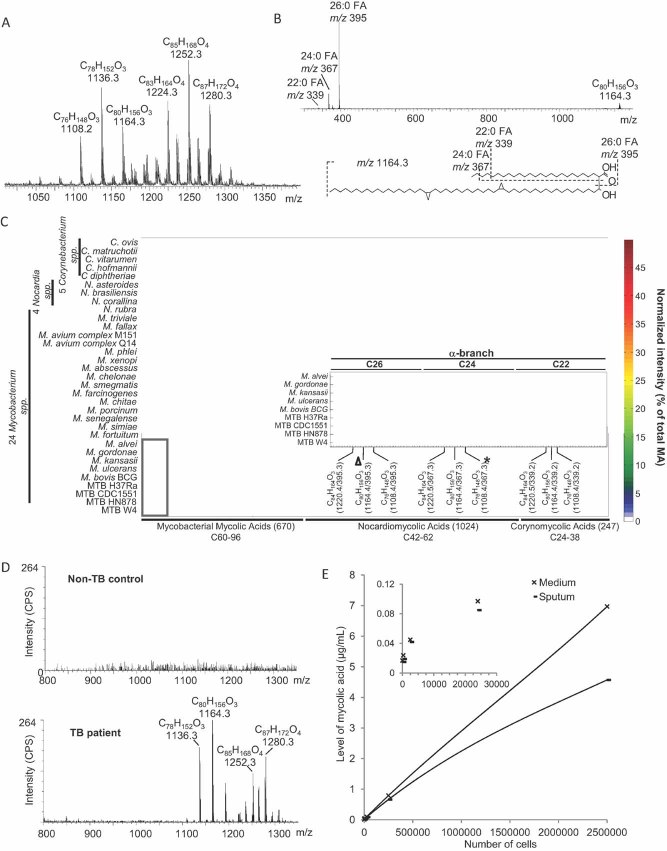
ESI/MS spectrum of MAs derived from MTB Beijing strain.
Product ion analysis (MS/MS) of m/z 1164, indicating the presence of C22:0 (m/z 339), C24:0 (m/z 367) and C26:0 (m/z 395) fatty acyls in the alpha-branch. See Figs S1–4 of Supporting information for additional ESI/MS of MAs derived from Corynebacteria, Nocardia and Mycobacteria. Based on these ESI/MS and MS/MS results, we developed a method for targeted analysis using MRM. Precursor/product ion pairs (i.e. MRM transitions) selective for 670 MAs of Mycobacteria, 1024 MAs of Nocardia and 247 MAs of Corynebacteria were used to profile 33 bacterial strains. The signal intensity for each MA species was normalized to the total signal intensity of all MAs measured in each strain (percent of total MA signal), and the resulting data is expressed in the heat plot format.
The inset shows an enlarged section of the α-MAs in nine mycobacterial strains (box). The triangle indicates a major α-MA C80H156O3 with C26 as the alpha-branch. The asterisk indicates the α-MA C76H148O3 with C24 as the alpha-branch. The full list of all 1942 MAs measured here, along with their MRM transitions and alpha-branch fatty acyl compositions, is shown in Table S1 of Supporting information.
Single stage mass spectra of sputum from a non-TB control and from a TB patient (ESI/MS). Ion counts are indicated as counts per second (CPS).
LOD of MA in sputum and in media. Serial dilutions of MTB were spiked into control sputum and medium. After MA extraction, the MA were resuspended in 120 µl of mobile phase and quantified by MRM and normalization to internal MA standard C32. Ion responses for both medium and sputum are shown using a non-linear polynomial regression curve.
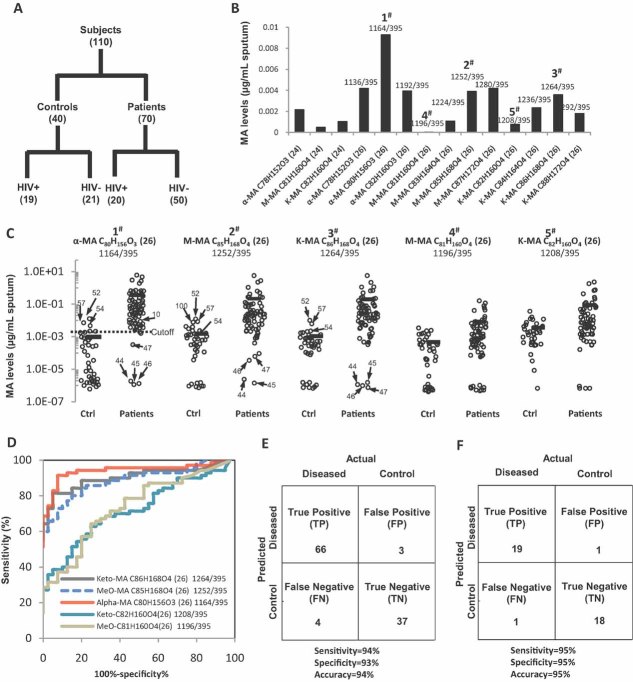
A. Diagram illustrating the case–control set-up and number of TB patients (n = 70) and non-TB controls (n = 40) analysed. Samples originated from four different countries (see Table S2 of Supporting information for detailed demographic information).
B. Sputum samples (200–500 µl) were extracted using organic solvents and levels of individual MA molecular species were determined using MS in MRM mode. Major MA species for α-MA (alpha-), M- (methoxy-) and K- (keto-) MA with their respective molecular composition are plotted, with (24) and (26) indicating the number of carbon atoms in their respective alpha chain.
C. Individual MA molecular species varied in their power to differentiate between non-TB controls and TB patients. Numbered dots highlighting false positive and false negative results correspond to patient IDs in Table S2 of Supporting information. Cutoff for MRM 1164/395 between non-TB control and patients is 0.0026 µg/ml sputum.
D. ROC curve displaying the classifying performance (positive diagnostic likelihood ratio) of individual MA molecular species, expressed by its true positive rate (sensitivity) and false positive rate (1—specificity), with α-MA C80H156O3 providing the best accuracy.
E,F. The predictive power of MA quantification is shown by confusion matrix for all 110 samples (E) and for the 39 HIV+ patients (F) alone. Sensitivity and specificity were calculated as described in the text.
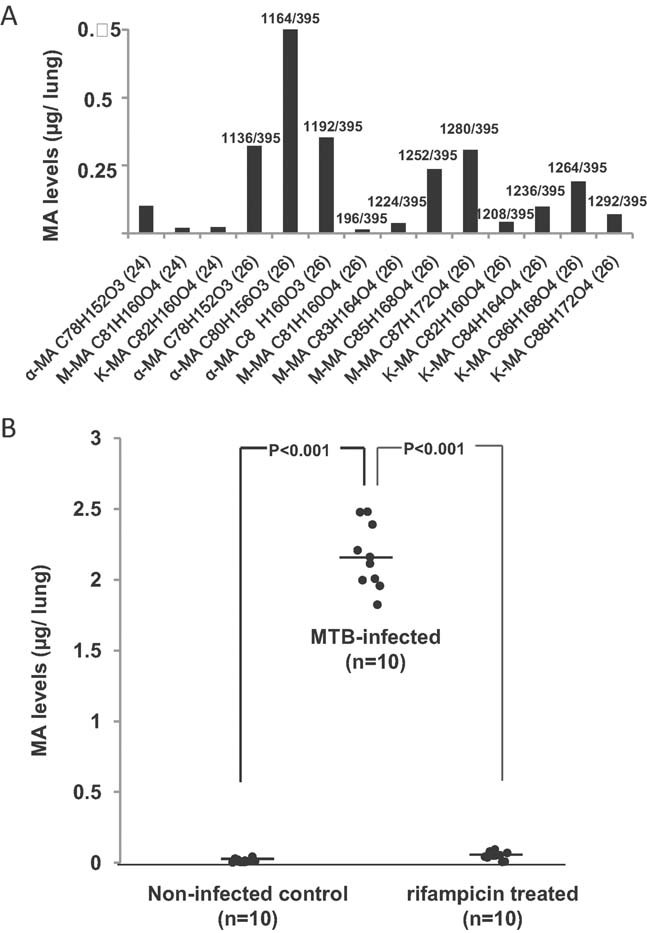
Levels of individual MA molecular species in the lung of one infected, untreated mouse 5 weeks post-infection.
MA levels of non-infected control mice compared to MTB-infected and to rifampicin-treated mice. The average bacillary load in this infections was 15.2 million CFU/lung (n = 5).
Similar articles
-
Quantification of mycolic acids in different mycobacterial species by standard addition method through liquid chromatography mass spectrometry.J Chromatogr B Analyt Technol Biomed Life Sci. 2024 Oct 15;1247:124297. doi: 10.1016/j.jchromb.2024.124297. Epub 2024 Sep 10. J Chromatogr B Analyt Technol Biomed Life Sci. 2024. PMID: 39299149
-
Diagnosing smear-negative tuberculosis using case definitions and treatment response in HIV-infected adults.Int J Tuberc Lung Dis. 2006 Jan;10(1):31-8. Int J Tuberc Lung Dis. 2006. PMID: 16466034
-
Identification of mycolic acid forms using surface-enhanced Raman scattering as a fast detection method for tuberculosis.Int J Nanomedicine. 2018 Oct 4;13:6029-6038. doi: 10.2147/IJN.S171400. eCollection 2018. Int J Nanomedicine. 2018. PMID: 30323590 Free PMC article.
-
Xpert MTB/RIF Ultra and Xpert MTB/RIF assays for extrapulmonary tuberculosis and rifampicin resistance in adults.Cochrane Database Syst Rev. 2021 Jan 15;1(1):CD012768. doi: 10.1002/14651858.CD012768.pub3. Cochrane Database Syst Rev. 2021. PMID: 33448348 Free PMC article.
-
Xpert MTB/RIF and Xpert MTB/RIF Ultra assays for active tuberculosis and rifampicin resistance in children.Cochrane Database Syst Rev. 2020 Aug 27;8(8):CD013359. doi: 10.1002/14651858.CD013359.pub2. Cochrane Database Syst Rev. 2020. Update in: Cochrane Database Syst Rev. 2022 Sep 6;9:CD013359. doi: 10.1002/14651858.CD013359.pub3. PMID: 32853411 Free PMC article. Updated.
Cited by
-
Pulmonary Isolation of Multidrug resistant "Mycobacterium simulans" and Mycobacterium tuberculosis from a patient in the Horn of Africa.Sci Rep. 2018 Oct 26;8(1):15341. doi: 10.1038/s41598-018-33737-9. Sci Rep. 2018. PMID: 30367075 Free PMC article.
-
High-resolution plasma metabolomics analysis to detect Mycobacterium tuberculosis-associated metabolites that distinguish active pulmonary tuberculosis in humans.PLoS One. 2018 Oct 11;13(10):e0205398. doi: 10.1371/journal.pone.0205398. eCollection 2018. PLoS One. 2018. PMID: 30308073 Free PMC article.
-
Ion mobility mass spectrometry for the study of mycobacterial mycolic acids.Sci Rep. 2023 Jun 27;13(1):10390. doi: 10.1038/s41598-023-37641-9. Sci Rep. 2023. PMID: 37369807 Free PMC article.
-
Mycobacteria-derived biomarkers for tuberculosis diagnosis.Indian J Med Res. 2017 Dec;146(6):700-707. doi: 10.4103/ijmr.IJMR_1441_16. Indian J Med Res. 2017. PMID: 29664027 Free PMC article. Review.
-
Cryo-EM structure of trimeric Mycobacterium smegmatis succinate dehydrogenase with a membrane-anchor SdhF.Nat Commun. 2020 Aug 25;11(1):4245. doi: 10.1038/s41467-020-18011-9. Nat Commun. 2020. PMID: 32843629 Free PMC article.
References
-
- Barry CE, III, Lee RE, Mdluli K, Sampson AE, Schroeder BG, Slayden RA, Yuan Y. Mycolic acids: structure, biosynthesis and physiological functions. Prog Lipid Res. 1998;37:143–179. - PubMed
-
- Ehrt S, Schnappinger D. Mycobacterium tuberculosis virulence: lipids inside and out. Nat Med. 2007;13:284–285. - PubMed
Publication types
MeSH terms
Substances
Grants and funding
LinkOut - more resources
Full Text Sources
Other Literature Sources
Medical
Molecular Biology Databases
