. 2012 Feb 3;287(6):4107-20.
doi: 10.1074/jbc.M111.308668. Epub 2011 Dec 6.

Different 8-hydroxyquinolines protect models of TDP-43 protein, α-synuclein, and polyglutamine proteotoxicity through distinct mechanisms

Affiliations

Different 8-hydroxyquinolines protect models of TDP-43 protein, α-synuclein, and polyglutamine proteotoxicity through distinct mechanisms

Daniel F Tardiff et al. J Biol Chem. .

Abstract

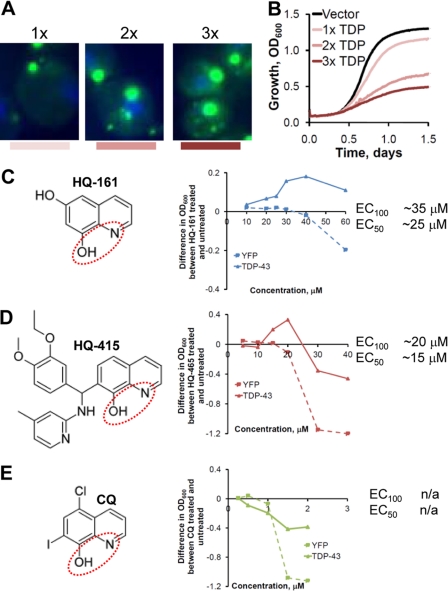
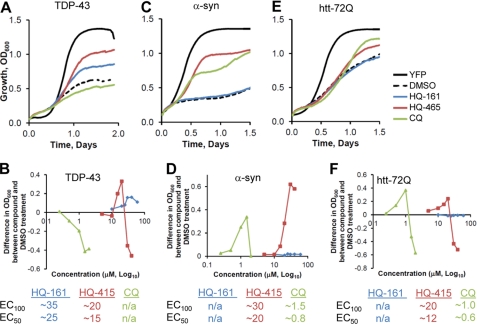
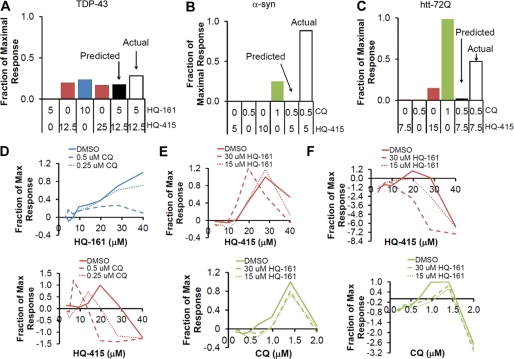
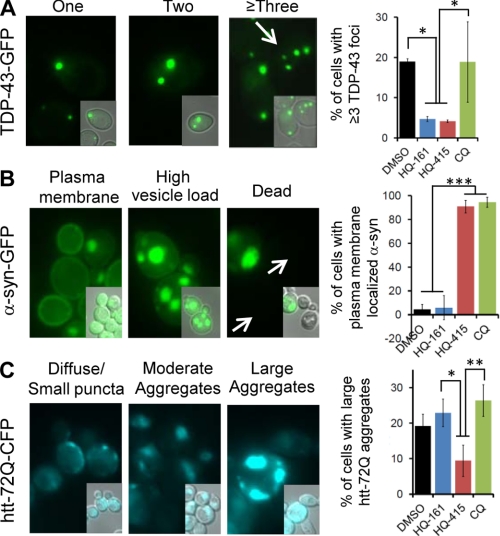
No current therapies target the underlying cellular pathologies of age-related neurodegenerative diseases. Model organisms provide a platform for discovering compounds that protect against the toxic, misfolded proteins that initiate these diseases. One such protein, TDP-43, is implicated in multiple neurodegenerative diseases, including amyotrophic lateral sclerosis and frontotemporal lobar degeneration. In yeast, TDP-43 expression is toxic, and genetic modifiers first discovered in yeast have proven to modulate TDP-43 toxicity in both neurons and humans. Here, we describe a phenotypic screen for small molecules that reverse TDP-43 toxicity in yeast. One group of hit compounds was 8-hydroxyquinolines (8-OHQ), a class of clinically relevant bioactive metal chelators related to clioquinol. Surprisingly, in otherwise wild-type yeast cells, different 8-OHQs had selectivity for rescuing the distinct toxicities caused by the expression of TDP-43, α-synuclein, or polyglutamine proteins. In fact, each 8-OHQ synergized with the other, clearly establishing that they function in different ways. Comparative growth and molecular analyses also revealed that 8-OHQs have distinct metal chelation and ionophore activities. The diverse bioactivity of 8-OHQs indicates that altering different aspects of metal homeostasis and/or metalloprotein activity elicits distinct protective mechanisms against several neurotoxic proteins. Indeed, phase II clinical trials of an 8-OHQ has produced encouraging results in modifying Alzheimer disease. Our unbiased identification of 8-OHQs in a yeast TDP-43 toxicity model suggests that tailoring 8-OHQ activity to a particular neurodegenerative disease may be a viable therapeutic strategy.


Figures

FIGURE 1.
FIGURE 1.
Small molecule screen of TDP-43 toxicity identifies 8-hydroxyquinolines. A, three yeast strains expressing one, two, or three copies of TDP-43-GFP show a dose-dependent increase in foci size and number. Green, TDP-43-GFP; blue, DNA/DAPI. B, increased TDP-43-GFP aggregation observed in A correlates with reduced growth rate and increase in toxicity. C, HQ-161 structure and dose-response curve in YFP and TDP-43-GFP yeast strains are shown. The functional chelating regions are circled in red. Values reflect the difference in growth (OD600) between the compound treated and DMSO control-treated strains at 36 h of a Bioscreen CTM growth experiment. Concentrations are in μm. The EC100 and EC50 are noted to the right of the dose-response curve. D, HQ-415 structure and dose-response curve in YFP and TDP-43-GFP yeast strains are shown. E, CQ structure and dose-response curve in YFP and TDP-43-GFP yeast strains are shown. HQ-161, HQ-415, and CQ are represented in blue, red, and green, respectively, throughout all figures.
FIGURE 2.
FIGURE 2.
8-Hydroxyquinolines rescue multiple models of proteotoxicity. 8-OHQs were tested in TDP-43 (A and B), α-syn (C and D), and htt-72Q (E and F) models of proteotoxicity. A, shown is representative growth curve of TDP-43 with most efficacious concentration of each 8-OHQ. B, shown is a dose-response curve of TDP-43 with each 8-OHQ where values reflect the difference in OD600 between compound-treated and DMSO control-treated cultures at 36 h of a Bioscreen CTM experiment. The x axis is log10, and concentrations are in μm. EC100 and EC50 are noted below the dose-response curves. C, shown is a representative growth curve of α-syn with the most efficacious concentrations of each 8-OHQ. D, shown is a dose-response curve of α-syn with each 8-OHQ. Values were taken from a 24-h time point. E, shown is a representative growth curve of htt-72Q with the most efficacious concentration of each 8-OHQ. F, shown is a dose-response curve of htt-72Q with each 8-OHQ. Values were taken from a 36-h time point.
FIGURE 3.
FIGURE 3.
8-hydroxyquinolines synergize in proteotoxicity models. Compound synergy between 8-OHQs was investigated with active pairs of compounds and active/inactive pairs of compounds in each model. A, shown is TDP-43 with a potential synergistic combination with 1- and 2-fold doses of HQ-161 and HQ-415. Predicted and actual values for the combined dose are indicated. Concentrations (μm) of HQ-161 and HQ-415 are indicated below the graph. B, the α-syn model with a synergistic combination of CQ and HQ-415 exhibits activity greater than predicted by simple additivity and a 2-fold dose of either single compound. C, shown is a potential synergistic combination of HQ-415 and CQ in htt-72Q. The activity of a 2-fold dose of CQ exceeds the actual activity of the combination of single doses. D, shown are dose-response curves of TDP-43 treated with HQ-161 (top) and HQ-415 (bottom) in the presence or absence of two constant concentrations of CQ (noted in the legend). E, shown are dose-response curves of α-syn treated with HQ-415 (top) and CQ (bottom) in the presence or absence of two constant concentrations of HQ-161 (noted in the legend). F, shown are dose-response curves of htt-72Q treated with HQ-415 (top) and CQ (bottom) in the presence or absence of two constant concentrations of HQ-161 (noted in the legend). Identity and concentrations of inactive compounds are noted in the legend. The active compound is color-coded according to other figures and noted below the x axis. The y axis is a fraction of the maximal response for that compound.
FIGURE 4.
FIGURE 4.
8-Hydroxyquinolines modify aspects of toxic protein accumulation and localization. A, representative cells expressing TDP-43-GFP are shown with different numbers of foci. Cells with three or more foci were quantified for TDP-43 cultures treated with DMSO or each 8-OHQ at its most efficacious concentration (right). Active compounds, HQ-161 and HQ-415, reduce the number of cells with three or more TDP-43 foci. B, representative cells with α-syn-GFP localized to the plasma membrane, cytoplasmic vesicle accumulations, or dead cells are shown. Quantitation of cells with plasma membrane-localized α-syn-GFP foci treated with DMSO or each 8-OHQ is shown (right). Active compounds, HQ-415 and CQ, increase the number of cells with plasma membrane localized α-syn-GFP. C, representative cells exhibiting diffuse/small punctuate htt-72Q-CFP, moderate aggregate loads, or high aggregates loads are shown with quantitation of large aggregates to the right. HQ-415 modestly reduced the number of cells with a high aggregate load, whereas CQ did not. Values reflect averages of three independent experiments, and error bars depict S.D. Significance was determined by one-way ANOVA with a Tukey test of multiple comparisons. *, p < 0.05; **, p < 0.01; ***, p < 0.001. CFP, cyan fluorescent protein.
FIGURE 5.
FIGURE 5.
8-Hydroxyquinolines rescue a C. elegans model of α-syn toxicity. A, C. elegans expressing α-syn in dopaminergic neurons were rescued by treatment with HQ-161, HQ-415, and CQ. Reported values are the percentage of worms that retained the wild-type number (6) of DA neurons. Experiments were performed at least three independent times and are compared with animals exposed to 0.2% DMSO vehicle only. Significance was determined by one-way ANOVA with a Tukey test of multiple comparisons. *, p < 0.05; **, p < 0.01. B, representative images show DA neuronal loss by α-syn expression in the anterior (head) region of a nematode exposed to vehicle alone (top) and an α-syn-expressing nematode rescued by HQ-415 where all six DA neurons are intact (bottom). Neurons are imaged GFPs whose expression is restricted to DA neurons by transcriptional control of the DA neuron-specific dat-1 promoter. Arrows with lines show present neurons (specifically axons), and arrowheads alone show locations of lost neurons. The neuronal cell bodies are the brightly fluorescent structures.
FIGURE 6.
FIGURE 6.
8-Hydroxyquinolines do not function as antioxidants. A, the antioxidants ascorbic acid (left) and N-acetylcysteine (right) rescue H2O2 toxicity. Values represent growth of the model normalized to an untreated YFP control strain after 24 h of a Bioscreen CTM growth assay. B, antioxidants do not rescue TDP-43, α-syn, or htt-72Q toxicity. Values represent growth of the model normalized to an untreated YFP control strains after 24 h (α-syn) or 36 h (TDP-43 and htt-72Q) of a Bioscreen CTM growth assay. TDP-43, α-syn, and htt-72Q are shown in purple, blue, and orange, respectively. C, H2O2 toxicity was not rescued by HQ-161, HQ-415, or CQ. Increasing concentrations of H2O2 were treated with concentrations of 8-OHQs indicated in the legend. Values represent growth relative to the non-H2O2, non-compound-treated condition after 24 h growth in 384-well plates.
FIGURE 7.
FIGURE 7.
8-Hydroxyquinolines possess both intracellular chelation and ionophore activities. 8-OHQs can either function as ionophores or be toxic to strains deleted for metal-responsive transcription factors. Strains individually deleted for mac1 (copper), aft1 (iron), or zap1 (zinc) were treated with HQ-161 (A), HQ-415 (B), or CQ (C) and compared with wild-type yeast at multiple concentrations. Values reflect growth of yeast treated with 8-OHQs relative to growth of yeast treated with DMSO alone. The single most instructive concentrations are shown. Three independent experiments were averaged, and significance was determined by Student's t test. D, shown is a heat map representation of ionophore (top) or toxic (bottom) activities of each transcription factor deletion strain. The values are the difference in percent growth between the deletion strain and the wild-type strain. Yellow, increased growth relative to no compound; blue, decreased growth relative to no compound; black, no effect on growth relative to no compound.
FIGURE 8.
FIGURE 8.
Intracellular metal chelation is the predominant protective activity of 8-hydroxyquinolines. A, RT-PCR analysis of 8-OHQ-treated WT cells revealed different metal depletion gene expression changes. Up-regulation of CTR1, FRE3, and ZTR1 transcripts served as indicators of copper, iron, and zinc depletion, respectively. Values are the average of three independent experiments and are reported normalized relative to an unchanging ACT1 control transcript. Significance was determined by one-way ANOVA with a Tukey test of multiple comparisons. *, p < 0.05; **, p < 0.01; ***, p < 0.001. B, the addition of copper and iron largely prevents rescue by 8-OHQs. Values are expressed as the difference in OD600 at 24 h (α-syn) or 36 h (TDP-43/htt-72Q) from DMSO control treated cultures. Yellow, rescue; blue, toxic; black, no effect. (−), C, F, and Z depict no metal, copper, iron, and zinc, respectively. C, metals rescued toxicity of 8-OHQs. Wild-type yeast were treated with toxic concentrations of each 8-OHQ and with two concentrations of each metal (either equimolar or a 2:1 8-OHQ:metal ratio). Yellow reflects rescue; black reflects no rescue.

References

    1. Goedert M. (2001) α-Synuclein and neurodegenerative diseases. Nat. Rev. Neurosci. 2, 492–501 - PubMed
    1. Selkoe D. J. (2008) Soluble oligomers of the amyloid β-protein impair synaptic plasticity and behavior. Behav. Brain Res. 192, 106–113 - PMC - PubMed
    1. Chen-Plotkin A. S., Lee V. M., Trojanowski J. Q. (2010) TAR DNA-binding protein 43 in neurodegenerative disease. Nat. Rev. Neurol. 6, 211–220 - PMC - PubMed
    1. Khurana V., Lindquist S. (2010) Modeling neurodegeneration in Saccharomyces cerevisiae. Why cook with baker's yeast? Nat. Rev. Neurosci. 11, 436–449 - PubMed
    1. Cooper A. A., Gitler A. D., Cashikar A., Haynes C. M., Hill K. J., Bhullar B., Liu K., Xu K., Strathearn K. E., Liu F., Cao S., Caldwell K. A., Caldwell G. A., Marsischky G., Kolodner R. D., Labaer J., Rochet J. C., Bonini N. M., Lindquist S. (2006) α-Synuclein blocks ER-Golgi traffic and Rab1 rescues neuron loss in Parkinson's models. Science 313, 324–328 - PMC - PubMed

Publication types

MeSH terms

LinkOut - more resources