

Protein expression signatures for inhibition of epidermal growth factor receptor-mediated signaling
- PMID: 22147731
- PMCID: PMC3277773
- DOI: 10.1074/mcp.M111.015222
Protein expression signatures for inhibition of epidermal growth factor receptor-mediated signaling
Abstract
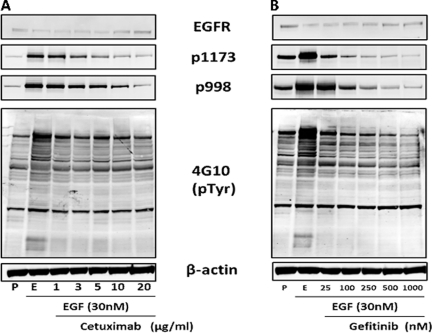
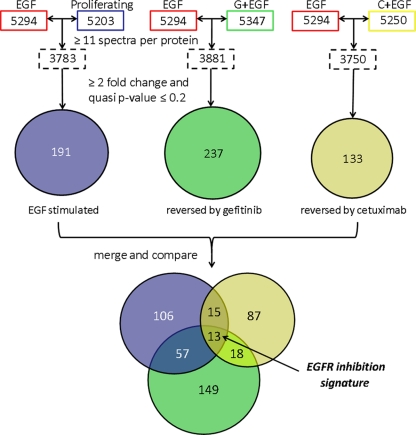
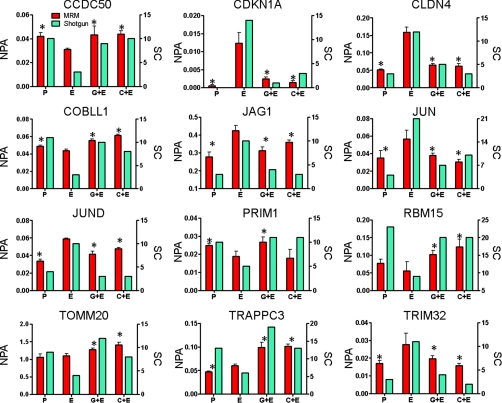
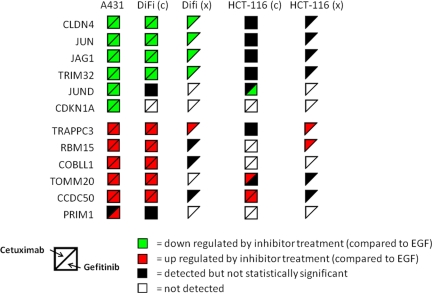
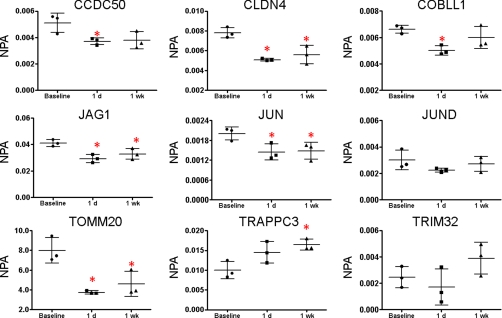
Analysis of cellular signaling networks typically involves targeted measurements of phosphorylated protein intermediates. However, phosphoproteomic analyses usually require affinity enrichment of phosphopeptides and can be complicated by artifactual changes in phosphorylation caused by uncontrolled preanalytical variables, particularly in the analysis of tissue specimens. We asked whether changes in protein expression, which are more stable and easily analyzed, could reflect network stimulation and inhibition. We employed this approach to analyze stimulation and inhibition of the epidermal growth factor receptor (EGFR) by EGF and selective EGFR inhibitors. Shotgun analysis of proteomes from proliferating A431 cells, EGF-stimulated cells, and cells co-treated with the EGFR inhibitors cetuximab or gefitinib identified groups of differentially expressed proteins. Comparisons of these protein groups identified 13 proteins whose EGF-induced expression changes were reversed by both EGFR inhibitors. Targeted multiple reaction monitoring analysis verified differential expression of 12 of these proteins, which comprise a candidate EGFR inhibition signature. We then tested these 12 proteins by multiple reaction monitoring analysis in three other models: 1) a comparison of DiFi (EGFR inhibitor-sensitive) and HCT116 (EGFR-insensitive) cell lines, 2) in formalin-fixed, paraffin-embedded mouse xenograft DiFi and HCT116 tumors, and 3) in tissue biopsies from a patient with the gastric hyperproliferative disorder Ménétrier's disease who was treated with cetuximab. Of the proteins in the candidate signature, a core group, including c-Jun, Jagged-1, and Claudin 4, were decreased by EGFR inhibitors in all three models. Although the goal of these studies was not to validate a clinically useful EGFR inhibition signature, the results confirm the hypothesis that clinically used EGFR inhibitors generate characteristic protein expression changes. This work further outlines a prototypical approach to derive and test protein expression signatures for drug action on signaling networks.
Figures
Similar articles
-
Combined epidermal growth factor receptor targeting with the tyrosine kinase inhibitor gefitinib (ZD1839) and the monoclonal antibody cetuximab (IMC-C225): superiority over single-agent receptor targeting.Clin Cancer Res. 2004 Oct 1;10(19):6487-501. doi: 10.1158/1078-0432.CCR-04-0870. Clin Cancer Res. 2004. PMID: 15475436
-
Epidermal growth factor competes with EGF receptor inhibitors to induce cell death in EGFR-overexpressing tumor cells.Cancer Lett. 2009 Oct 8;283(2):135-42. doi: 10.1016/j.canlet.2009.03.034. Epub 2009 Apr 19. Cancer Lett. 2009. PMID: 19380191
-
Sprouty2 protein enhances the response to gefitinib through epidermal growth factor receptor in colon cancer cells.Cancer Sci. 2010 Sep;101(9):2033-8. doi: 10.1111/j.1349-7006.2010.01637.x. Cancer Sci. 2010. PMID: 20624167 Free PMC article.
-
Radiation response modification following molecular inhibition of epidermal growth factor receptor signaling.Semin Radiat Oncol. 2001 Oct;11(4):281-9. doi: 10.1053/srao.2001.26027. Semin Radiat Oncol. 2001. PMID: 11677653 Review.
-
Epidermal growth factor receptor (EGFR) targeted therapies in non-small cell lung cancer (NSCLC).Rev Recent Clin Trials. 2006 Jan;1(1):1-13. doi: 10.2174/157488706775246157. Rev Recent Clin Trials. 2006. PMID: 18393776 Review.
Cited by
-
Deep Phospho- and Phosphotyrosine Proteomics Identified Active Kinases and Phosphorylation Networks in Colorectal Cancer Cell Lines Resistant to Cetuximab.Sci Rep. 2017 Sep 5;7(1):10463. doi: 10.1038/s41598-017-10478-9. Sci Rep. 2017. PMID: 28874695 Free PMC article.
-
Applications of mass spectrometry for quantitative protein analysis in formalin-fixed paraffin-embedded tissues.Proteomics. 2014 Mar;14(4-5):441-51. doi: 10.1002/pmic.201300311. Proteomics. 2014. PMID: 24339433 Free PMC article. Review.
-
Optimized Protocol for Quantitative Multiple Reaction Monitoring-Based Proteomic Analysis of Formalin-Fixed, Paraffin-Embedded Tissues.J Proteome Res. 2016 Aug 5;15(8):2717-28. doi: 10.1021/acs.jproteome.6b00245. Epub 2016 Jul 27. J Proteome Res. 2016. PMID: 27462933 Free PMC article.
-
Lack of interaction between ErbB2 and insulin receptor substrate signaling in breast cancer.Cell Commun Signal. 2016 Oct 21;14(1):25. doi: 10.1186/s12964-016-0148-8. Cell Commun Signal. 2016. PMID: 27765041 Free PMC article.
-
Quantitative Profiling of Protein Tyrosine Kinases in Human Cancer Cell Lines by Multiplexed Parallel Reaction Monitoring Assays.Mol Cell Proteomics. 2016 Feb;15(2):682-91. doi: 10.1074/mcp.O115.056713. Epub 2015 Dec 2. Mol Cell Proteomics. 2016. PMID: 26631510 Free PMC article.
References
-
- Zhang Y., Wolf-Yadlin A., Ross P. L., Pappin D. J., Rush J., Lauffenburger D. A., White F. M. (2005) Time-resolved mass spectrometry of tyrosine phosphorylation sites in the epidermal growth factor receptor signaling network reveals dynamic modules. Mol. Cell. Proteomics 4, 1240–1250 - PubMed
-
- Hinsby A. M., Olsen J. V., Mann M. (2004) Tyrosine phosphoproteomics of fibroblast growth factor signaling. J. Biol. Chem. 279, 46438–46447 - PubMed
-
- Rexer B. N., Ham A. J., Rinehart C., Hill S., de Matos Granja-Ingram N., González-Angulo A. M., Mills G. B., Dave B., Chang J. C., Liebler D. C., Arteaga C. L. (2011) Phosphoproteomic mass spectrometry profiling links Src family kinases to escape from HER2 tyrosine kinase inhibition. Oncogene 30, 4163–4174 - PMC - PubMed
-
- Li X., Gerber S. A., Rudner A. D., Beausoleil S. A., Haas W., Villén J., Elias J. E., Gygi S. P. (2007) Large-scale phosphorylation analysis of α-factor-arrested Saccharomyces cerevisiae. J. Proteome Res. 6, 1190–1197 - PubMed
Publication types
MeSH terms
Substances
Grants and funding
LinkOut - more resources
Full Text Sources
Other Literature Sources
Medical
Research Materials
Miscellaneous
