

Plasmacytoid dendritic cells and C1q differentially regulate inflammatory gene induction by lupus immune complexes
- PMID: 22147767
- PMCID: PMC3238790
- DOI: 10.4049/jimmunol.1102797
Plasmacytoid dendritic cells and C1q differentially regulate inflammatory gene induction by lupus immune complexes
Abstract
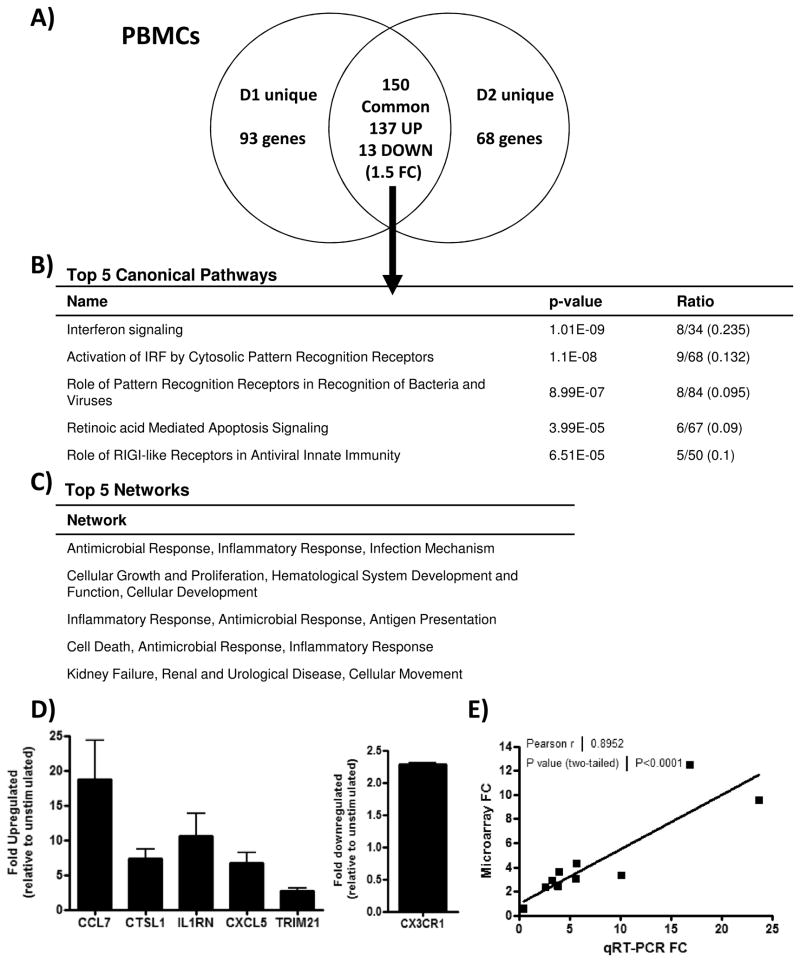
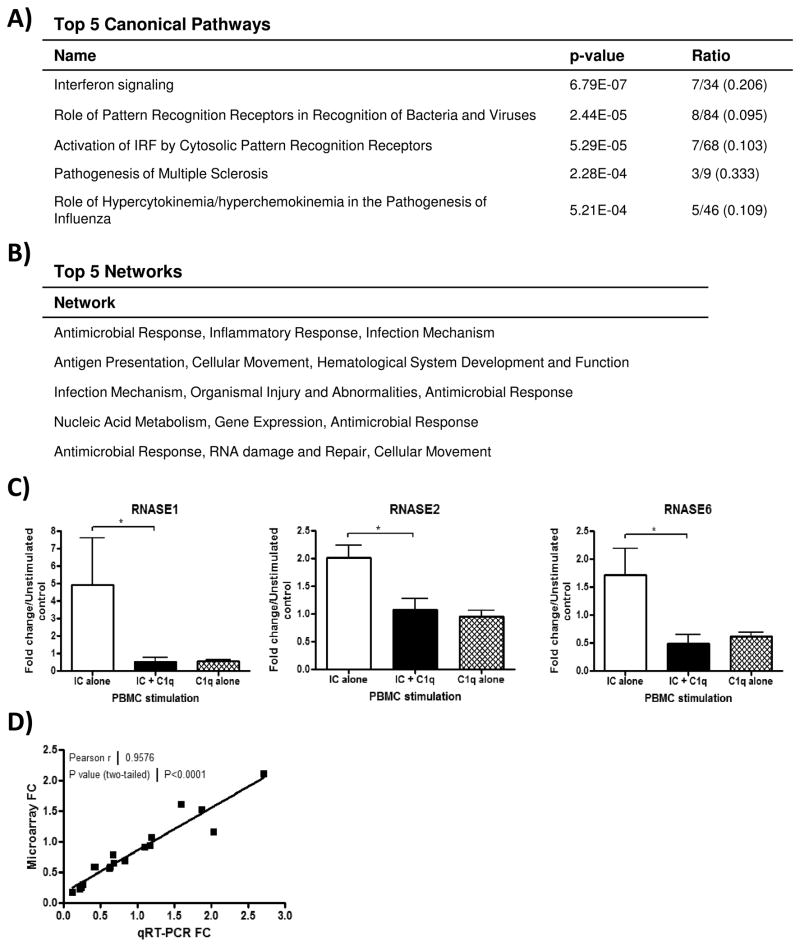
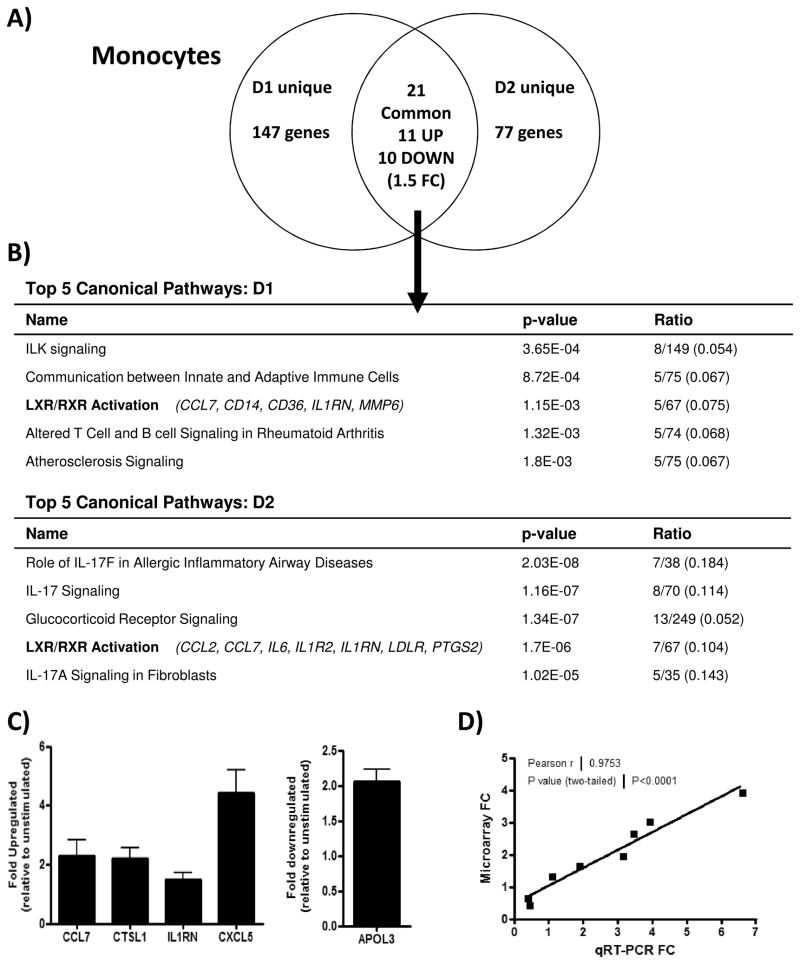
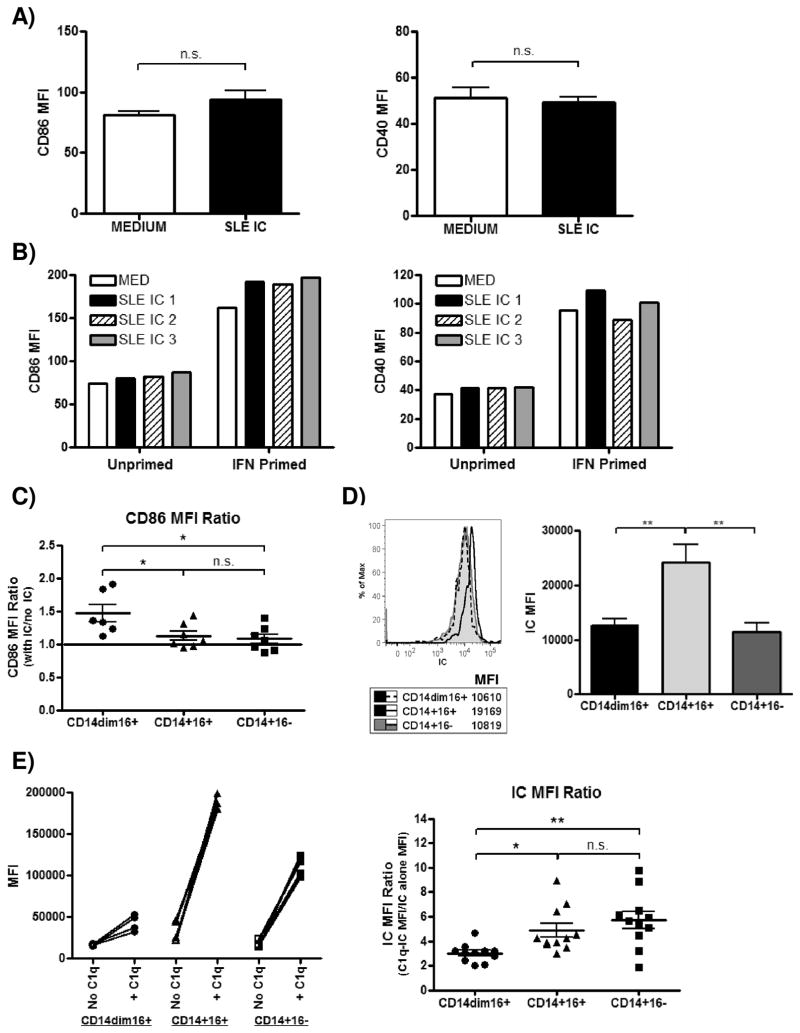
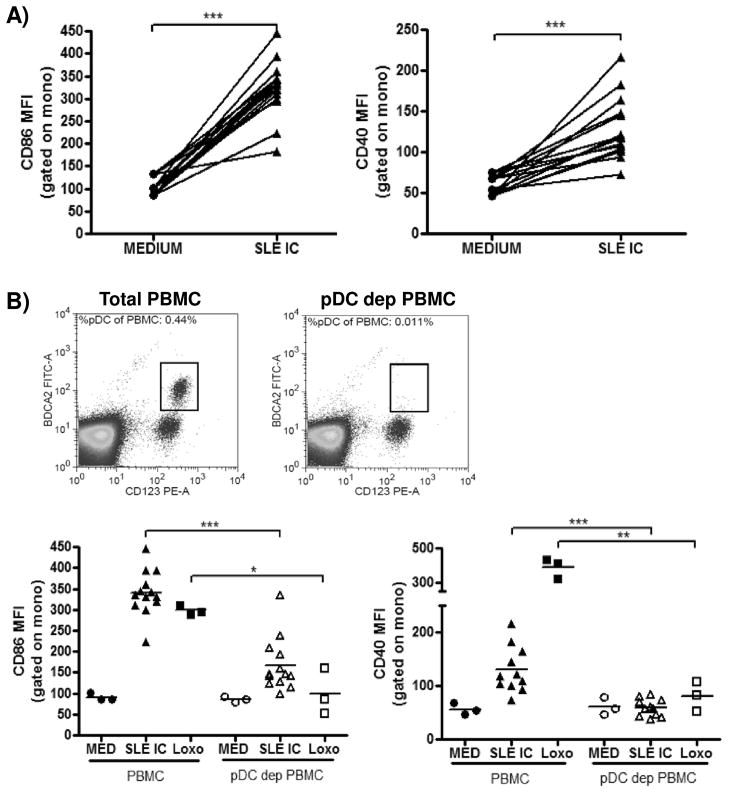
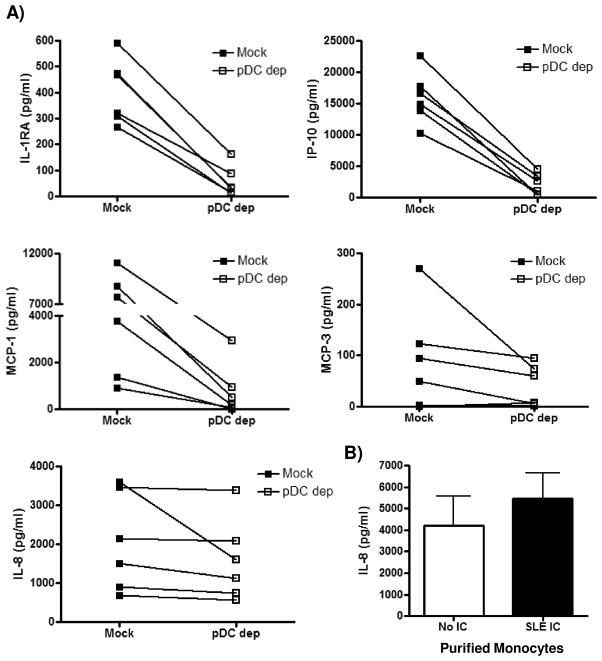
Immune complexes (ICs) play a pivotal role in causing inflammation in systemic lupus erythematosus (SLE). Yet, it remains unclear what the dominant blood cell type(s) and inflammation-related gene programs stimulated by lupus ICs are. To address these questions, we exposed normal human PBMCs or CD14(+) isolated monocytes to SLE ICs in the presence or absence of C1q and performed microarray analysis and other tests for cell activation. By microarray analysis, we identified genes and pathways regulated by SLE ICs that are both type I IFN dependent and independent. We also found that C1q-containing ICs markedly reduced expression of the majority of IFN-response genes and also influenced the expression of multiple other genes induced by SLE ICs. Surprisingly, IC activation of isolated CD14(+) monocytes did not upregulate CD40 and CD86 and only modestly stimulated inflammatory gene expression. However, when monocyte subsets were purified and analyzed separately, the low-abundance CD14(dim) ("patrolling") subpopulation was more responsive to ICs. These observations demonstrate the importance of plasmacytoid dendritic cells, CD14(dim) monocytes, and C1q as key regulators of inflammatory properties of ICs and identify many pathways through which they act.
Figures
Similar articles
-
C1q deficiency leads to the defective suppression of IFN-alpha in response to nucleoprotein containing immune complexes.J Immunol. 2010 Oct 15;185(8):4738-49. doi: 10.4049/jimmunol.1001731. Epub 2010 Sep 15. J Immunol. 2010. PMID: 20844193 Free PMC article.
-
C1q inhibits immune complex-induced interferon-alpha production in plasmacytoid dendritic cells: a novel link between C1q deficiency and systemic lupus erythematosus pathogenesis.Arthritis Rheum. 2009 Oct;60(10):3081-90. doi: 10.1002/art.24852. Arthritis Rheum. 2009. PMID: 19790049
-
Complement, interferon and lupus.Curr Opin Immunol. 2012 Dec;24(6):665-70. doi: 10.1016/j.coi.2012.08.004. Epub 2012 Sep 20. Curr Opin Immunol. 2012. PMID: 22999705 Review.
-
Potential Involvement of Platelet-Derived Microparticles and Microparticles Forming Immune Complexes during Monocyte Activation in Patients with Systemic Lupus Erythematosus.Front Immunol. 2018 Mar 1;9:322. doi: 10.3389/fimmu.2018.00322. eCollection 2018. Front Immunol. 2018. PMID: 29545790 Free PMC article. Clinical Trial.
-
The central role of dendritic cells and interferon-alpha in SLE.Curr Opin Rheumatol. 2003 Sep;15(5):548-56. doi: 10.1097/00002281-200309000-00005. Curr Opin Rheumatol. 2003. PMID: 12960479 Review.
Cited by
-
Pivotal Functions of Plasmacytoid Dendritic Cells in Systemic Autoimmune Pathogenesis.J Clin Cell Immunol. 2014 Apr 22;5(2):212. doi: 10.4172/2155-9899.1000212. J Clin Cell Immunol. 2014. PMID: 25077037 Free PMC article.
-
Early, transient depletion of plasmacytoid dendritic cells ameliorates autoimmunity in a lupus model.J Exp Med. 2014 Sep 22;211(10):1977-91. doi: 10.1084/jem.20132620. Epub 2014 Sep 1. J Exp Med. 2014. PMID: 25180065 Free PMC article.
-
Mitochondrial protein CMPK2 regulates IFN alpha-enhanced foam cell formation, potentially contributing to premature atherosclerosis in SLE.Arthritis Res Ther. 2021 Apr 19;23(1):120. doi: 10.1186/s13075-021-02470-6. Arthritis Res Ther. 2021. PMID: 33874983 Free PMC article.
-
Uncoupling complement C1s activation from C1q binding in apoptotic cell phagocytosis and immunosuppressive capacity.Clin Immunol. 2016 Feb;163:84-90. doi: 10.1016/j.clim.2015.12.017. Epub 2016 Jan 6. Clin Immunol. 2016. PMID: 26769276 Free PMC article.
-
Development and function of chicken XCR1+ conventional dendritic cells.Front Immunol. 2023 Oct 25;14:1273661. doi: 10.3389/fimmu.2023.1273661. eCollection 2023. Front Immunol. 2023. PMID: 37954617 Free PMC article.
References
-
- Tan EM. Antinuclear antibodies: diagnostic markers for autoimmune diseases and probes for cell biology. Adv Immunol. 1989;44:93–151. - PubMed
-
- Hahn BH. Antibodies to DNA. The New England journal of medicine. 1998;338:1359–1368. - PubMed
-
- Koffler D, Agnello V, Thoburn R, Kunkel HG. Systemic lupus erythematosus: prototype of immune complex nephritis in man. J Exp Med. 1971;134:169s–179s. - PubMed
-
- Ravetch JV, Bolland S. IgG Fc receptors. Annu Rev Immunol. 2001;19:275–290. - PubMed
-
- Baatrup G. Immune complex modulation by plasma proteins. With special reference to the complement system and autoimmune diseases. Dan Med Bull. 1989;36:443–463. - PubMed
Publication types
MeSH terms
Substances
Associated data
- Actions
Grants and funding
LinkOut - more resources
Full Text Sources
Other Literature Sources
Medical
Molecular Biology Databases
Research Materials
Miscellaneous
