. 2012 Jan 15;188(2):800-10.
doi: 10.4049/jimmunol.1100769. Epub 2011 Dec 5.

Microbial infection-induced expansion of effector T cells overcomes the suppressive effects of regulatory T cells via an IL-2 deprivation mechanism

Affiliations

Microbial infection-induced expansion of effector T cells overcomes the suppressive effects of regulatory T cells via an IL-2 deprivation mechanism

Alicia Benson et al. J Immunol. .

Abstract

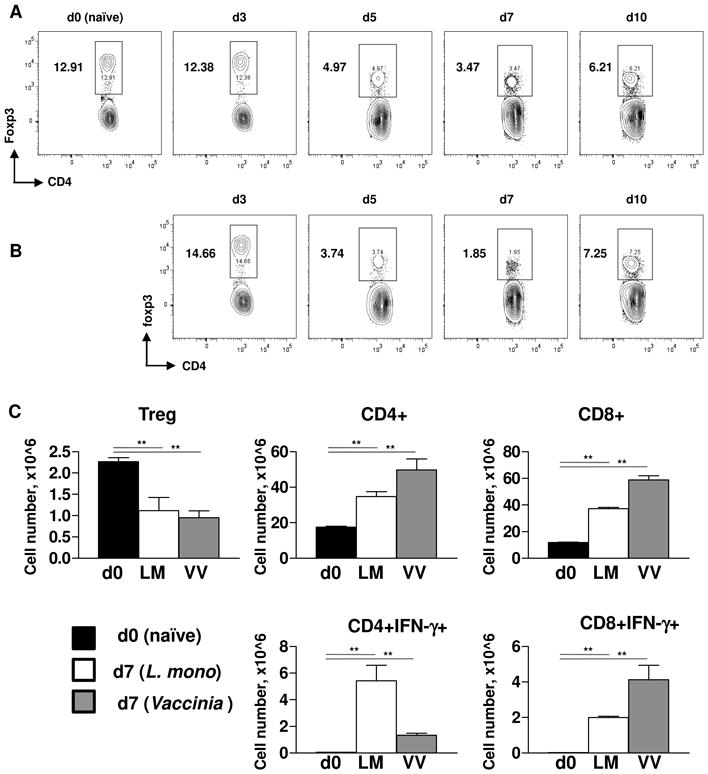
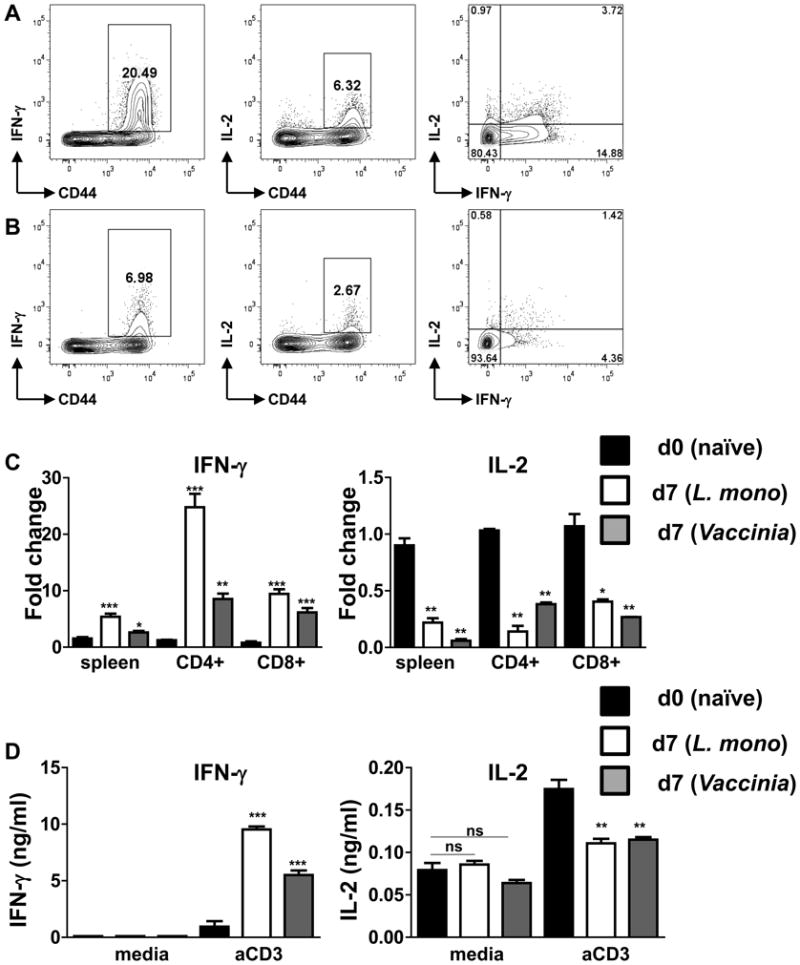
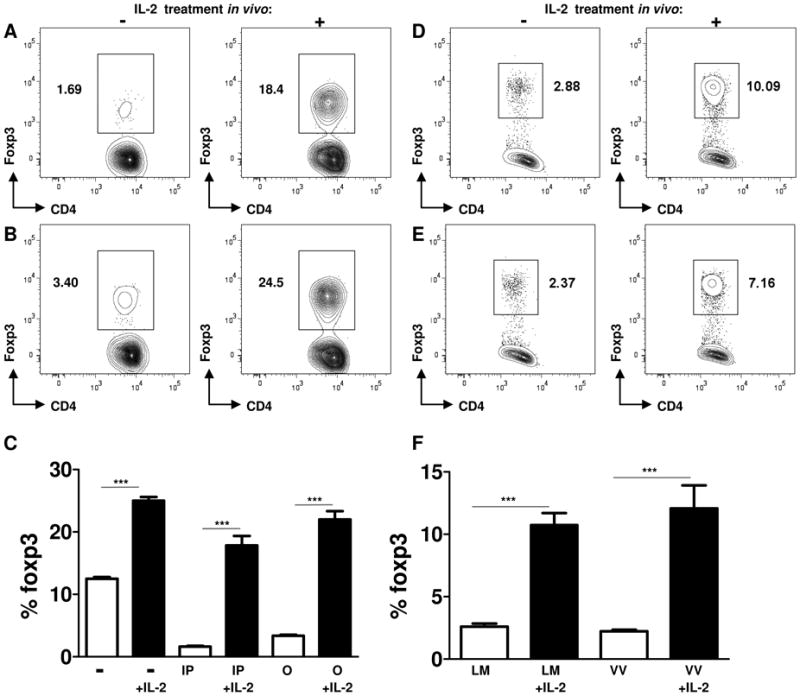
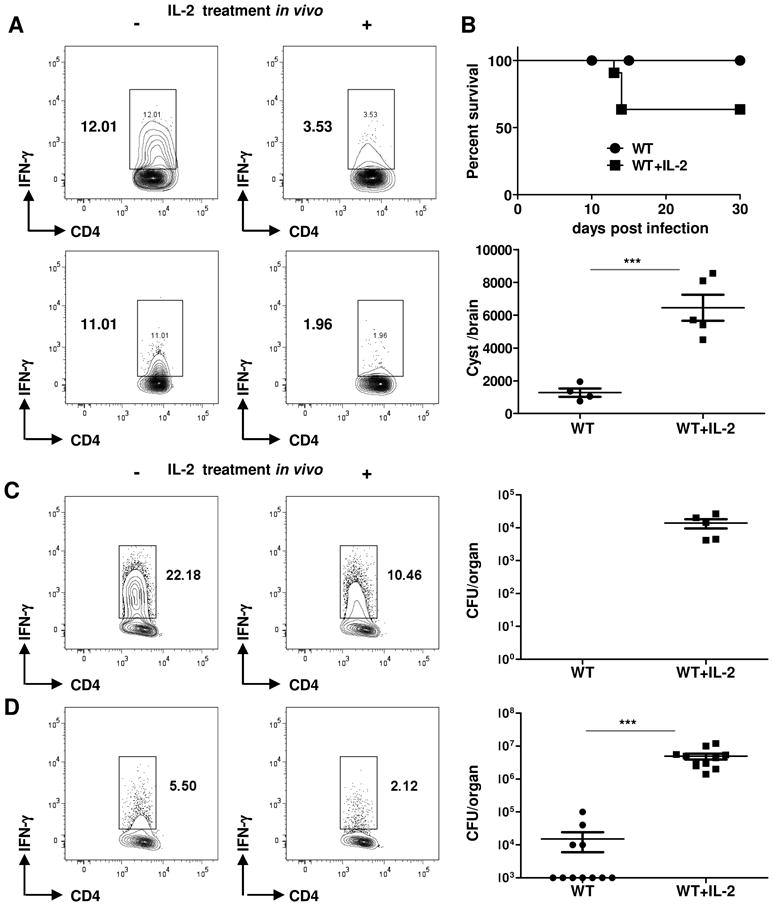
Foxp3(+) regulatory T (Treg) cells are a critical cell population that suppresses T cell activation in response to microbial and viral pathogens. We identify a cell-intrinsic mechanism by which effector CD4(+) T cells overcome the suppressive effects of Treg cells in the context of three distinct infections: Toxoplasma gondii, Listeria monocytogenes, and vaccinia virus. The acute responses to the parasitic, bacterial, and viral pathogens resulted in a transient reduction in frequency and absolute number of Treg cells. The infection-induced partial loss of Treg cells was essential for the initiation of potent Th1 responses and host protection against the pathogens. The observed disappearance of Treg cells was a result of insufficiency in IL-2 caused by the expansion of pathogen-specific CD4(+) T cells with a limited capacity of IL-2 production. Exogenous IL-2 treatment during the parasitic, bacterial, and viral infections completely prevented the loss of Treg cells, but restoration of Treg cells resulted in a greatly enhanced susceptibility to the pathogens. These results demonstrate that the transient reduction in Treg cells induced by pathogens via IL-2 deprivation is essential for optimal T cell responses and host resistance to microbial and viral pathogens.


Figures

Figure 1
Figure 1
The acute response to T. gondii results in the transient loss of Treg cells. WT mice (five animals per group) were infected intraperitoneally with an average of 20 T. gondii strain ME49 cysts per mouse, and (A) the frequency of Treg cells defined as CD4+Foxp3+ cells was analyzed in the spleen of the infected and control (d0) mice at the indicated number of days post-infection. (B) Foxp3 expression levels were analyzed in splenocytes (left graph), isolated CD4+ T cells (central graph), or sort-purified CD4+Foxp3+ T cells (right) isolated from naïve or T. gondii infected mice (day 7 post infection) by real-time PCR. All the data were normalized to the expression level seen in sort-purified CD4+CD44-Foxp3- naïve T cells. The data shown are the mean ± SD. (C) WT mice were infected orally with an average of 20 T. gondii strain ME49 cysts per mouse, and the frequency of Treg cells was analyzed in the spleen of the infected mice at the indicated number of days post-infection. (D) Average frequency of Foxp3+ cells in the spleens of mice infected intraperitoneally (filled circles) or orally (open circles). (E) Absolute quantification of Treg cells in the spleens of mice infected intraperitoneally (filled circles) or orally (open circles) with the parasite. The data shown are representative of five independent experiments. (F). Absolute quantification of CD4+ and CD4+IFN-γ+ T cells in the spleens of naïve (d0) and T. gondii infected mice (d7). The data shown are representative of at least six independent experiments. * P< 0.05; ** P< 0.01.
Figure 2
Figure 2
Acute responses to L. monocytogenes and vaccinia virus caused loss of Treg cells. WT mice (five animals per group) were infected intravenously with (A) L. monocytogenes (104 CFU per mouse) or (B) vaccinia virus (106 PFU per mouse), and the frequency of splenic Treg cells was analyzed at the indicated number of days post-infection. (C) Absolute quantification of Treg cells (CD4+Foxp3+), CD4+, CD8+, CD4+IFN-γ+, and CD8+IFN-γ+ cells was performed in naïve (black bars), L. monocytogenes (open bars), or vaccinia virus (grey bars) infected mice on day 7 post infection. The data shown are the mean ± SD. For identification of IFN-γ+ cells splenocytes were restimulated with 0.5 μg/ml αCD3 for 5 hr in the presence of GolgiPlug. The data shown are representative of four independent experiments. ** P< 0.01.
Figure 3
Figure 3
T. gondii-specific Th1 T cells produce limited amounts of IL-2 WT animals (five mice per group) were either left untreated (A) or infected with T. gondii intraperitoneally (B) or orally (C), and seven days later, the ability of splenic CD4+ T cells to produce IFN-γ, TNF, and IL-2 was analyzed. Analyses of intracellular cytokine expression were performed on splenocytes restimulated with 0.5 μg/ml αCD3 for 5 hr in the presence of GolgiPlug. (D) Expression levels of IFN-γ and (E) IL-2 were analyzed by real-time PCR in splenocytes, CD4+, CD8+, and CD4+Foxp3+ T cells isolated from naïve or T. gondii infected mice (day 7 post infection). (F) IL-2 in cell culture supernatant was measured by ELISA on splenocytes isolated from naïve (d0) or T. gondii infected mice at the indicated time points after restimulation with 0.01 ug/ml αCD3 for 48 hr. (G) Expression levels of CD25 were analyzed by real-time PCR in naïve or T. gondii infected mice (day 7) on the same samples as shown in (D and E). The data shown are representative of five independent experiments. * P< 0.05; ** P< 0.01, *** P< 0.001.
Figure 4
Figure 4
L. monocytogenes- and vaccinia virus-specific CD4+ T cells produce limited amounts of IL-2. WT mice (five animals per group) were infected with (A) L. monocytogenes (104 CFU per mouse) or (B) vaccinia virus (106 PFU per mouse), and the ability of CD4+ T cells to secrete IFN-γ and IL-2 was analyzed by flow cytometry after restimulation with 0.5 ug/ml αCD3 for 5 hr in the presence of GolgiPlug. (C) Expression levels of IFN-γ (left panel) and IL-2 (right panel) were analyzed by real-time PCR in naïve (black bars), L. monocytogenes (open bars) and vaccinia virus (grey bars) infected mice on day 7 post infection. (D) IFN-γ and IL-2 were measured by ELISA in unstimulated (media) or 0.01 ug/ml αCD3 restimulated splenocytes isolated from naïve (black bars), L. monocytogenes (open bars) and vaccinia virus (grey bars) infected mice. The data shown are representative of four independent experiments. * P< 0.05; ** P< 0.01, *** P< 0.001.
Figure 5
Figure 5
Exogenous IL-2 treatment during parasitic, bacterial, and viral infections prevented the loss of Treg cells WT mice (n=5) were infected intraperitoneally (A) or orally (B) with T. gondii and additionally treated with IL-2 (1.5 μg of IL-2 plus 50 μg of anti-IL-2 antibody per mouse). The Treg cell frequency was analyzed by flow cytometry on day 7 post-infection. (C) Average frequency of Foxp3+ cells in the spleens of control (−), intraperitoneally (IP) or orally (O) infected mice treated with IL-2 plus anti-IL-2 antibody (+IL-2). The data shown are the mean ± SD. Animals were infected with (D) L. monocytogenes (104 CFU per mouse) or (E) vaccinia virus (106 PFU per mouse) and where indicated, were treated with exogenous IL-2 as described above. Treg cells were analyzed in IL-2 treated (+) and untreated (−) mice on day 7 post-infection. (F) The data shown are the mean frequency of Treg cells ± SD in L. monocytogenes (LM) or vaccinia virus (VV) infected mice. The data shown are representative of three independent experiments. *** P< 0.001.
Figure 6
Figure 6
Exogenous IL-2 treatment during parasitic, bacterial, and viral infections results in enhanced susceptibility to the pathogen. (A) T. gondii-infected animals (five mice per group) were treated with the IL-2/anti-IL-2 complex, and Th1 polarization was analyzed on day 7 post-infection. (B) The cumulative survival and the cyst burden on day 30 post-infection are shown for untreated and IL-2-treated mice. (C) L. monocytogenes- or (D) vaccinia virus-infected animals were additionally treated with IL-2 (+), and Th1 polarization and pathogen loads were analyzed on day 7 post-infection. The data shown are representative of five independent experiments for T. gondii and three independent experiments for L. monocytogenes and vaccinia virus infections. *** P< 0.001.
Figure 7
Figure 7
Peripheral Treg cell conversion by ALDH+CD11b+ and CD11c+ DC cells. (A) The relative (left panel) and absolute (right panel) counts of ALDH+CD11b+ cells at the indicated time points after T. gondii infection. The appearance of ALDH+ cells in response to T. gondii infection was analyzed by flow cytometry on days 0, 7, 10, 14, 21, and 28 post-infection shown in Figure S4. (B) ALDH+CD11b+ and ALDH-CD11c+ cells were sort-purified from spleens of T. gondii-infected mice on day 7 post-infection and were mixed with sort-purified Foxp3GFP- CD4+ T cells in the presence of αCD3 alone or in combination with IL-2 and TGF-β. T cell Foxp3 expression was examined by flow cytometry after 3 days of culture. Plots are gated on CD4+ cells, and the percentages of Foxp3+ cells are shown. The data shown are representative of three experiments. * P< 0.1; ** P< 0.01.
Figure 8
Figure 8
Thymic Treg cells are relatively resistant to infection-induced Treg cell loss. (A) WT mice (five animals per group) were infected intraperitoneally with an average of 20 T. gondii strain ME49 cysts per mouse, and the frequency of Treg cells, among all CD+ T cells, was analyzed in the thymus of the infected and control mice at the indicated number of days post-infection. Analysis of thymic Treg cell proliferation was performed by intracellular staining for the nuclear antigen Ki67. Average frequency of (B) Foxp3+ cells and (C) Foxp3+Ki67+ CD4+ T cells in the thymus of T. gondii-infected mice. (D) Absolute quantification of Treg cells in the thymus of mice infected with the parasite. The data shown are representative of three independent experiments. * P< 0.05.

Similar articles

Cited by

References

    1. Sakaguchi S, Yamaguchi T, Nomura T, Ono M. Regulatory T cells and immune tolerance. Cell. 2008;133:775–787. - PubMed
    1. Fontenot JD, Rasmussen JP, Gavin MA, Rudensky AY. A function for interleukin 2 in Foxp3-expressing regulatory T cells. Nature Immunology. 2005;6:1142–1151. - PubMed
    1. Hori S, Nomura T, Sakaguchi S. Control of regulatory T cell development by the transcription factor Foxp3. Science. 2003;299:1057–1061. - PubMed
    1. Nishikawa H, Jager E, Ritter G, Old LJ, Gnjatic S. CD4(+) CD25(+) regulatory T cells control the induction of antigen-specific CD4(+) helper T cell responses in cancer patients. Blood. 2005;106:1008–1011. - PubMed
    1. Belkaid Y, Piccirillo CA, Mendez S, Shevach EM, Sacks DL. CD4(+)CD25(+) regulatory T cells control Leishmania major persistence and immunity. Nature. 2002;420:502–507. - PubMed

Publication types

MeSH terms