. 2012 Jan 26;119(4):1018-28.
doi: 10.1182/blood-2011-06-363887. Epub 2011 Dec 6.

Global gene expression profiling in mouse plasma cell tumor precursor and bystander cells reveals potential intervention targets for plasma cell neoplasia

Affiliations

Global gene expression profiling in mouse plasma cell tumor precursor and bystander cells reveals potential intervention targets for plasma cell neoplasia

Jason LeGrand et al. Blood. .

Abstract

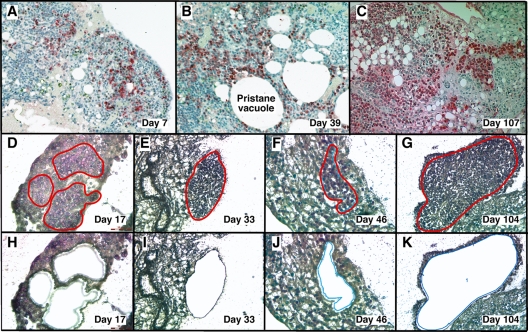
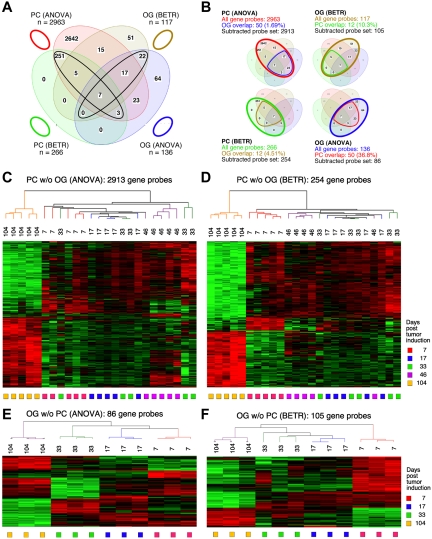
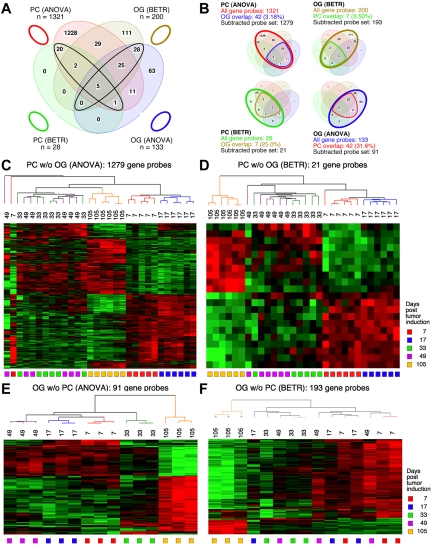
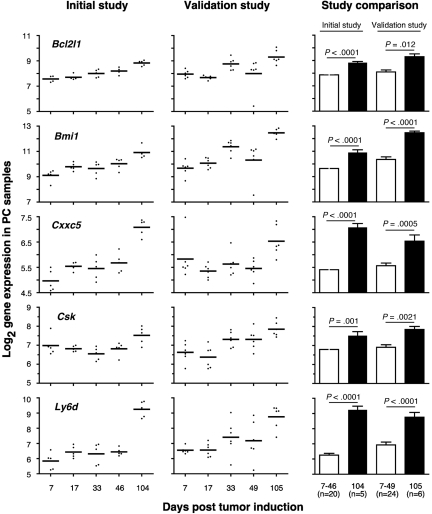
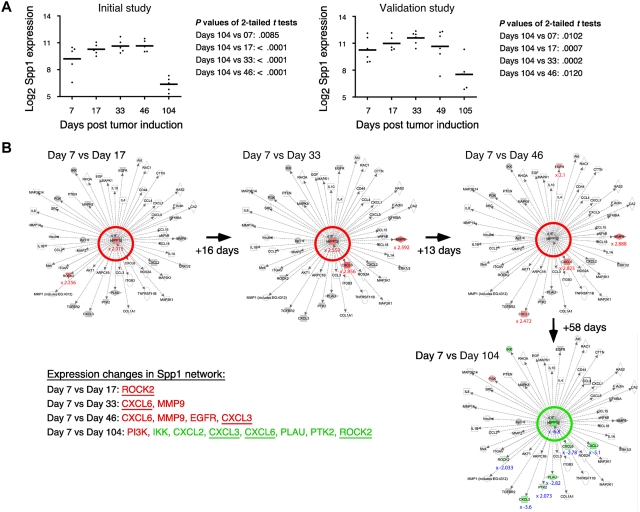
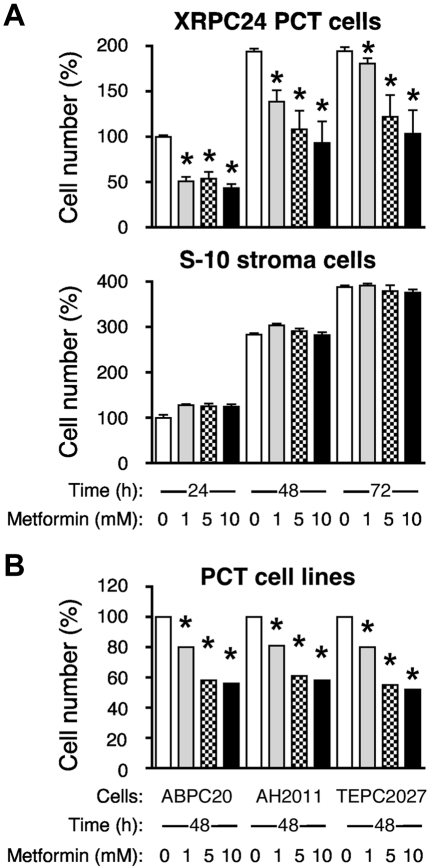
Tumor progression usually proceeds through several sequential stages, any of which could be targets for interrupting the progression process if one understood these steps at the molecular level. We extracted nascent plasma cell tumor (PCT) cells from within inflammatory oil granulomas (OG) isolated from IP pristane-injected BALB/c.iMyc(Eμ) mice at 5 different time points during tumor progression. We used laser capture microdissection to collect incipient PCT cells and analyzed their global gene expression on Affymetrix Mouse Genome 430A microarrays. Two independent studies were performed with different sets of mice. Analysis of the expression data used ANOVA and Bayesian estimation of temporal regulation. Genetic pathway analysis was performed using MetaCore (GeneGo) and IPA (Ingenuity). The gene expression profiles of PCT samples and those of undissected OG samples from adjacent sections showed that different genes and pathways were mobilized in the tumor cells during tumor progression, compared with their stroma. Our analysis implicated several genetic pathways in PCT progression, including biphasic (up- and then down-regulation) of the Spp1/osteopontin-dependent network and up-regulation of mRNA translation/protein synthesis. The latter led to a biologic validation study that showed that the AMPK-activating diabetes drug, metformin, was a potent specific PCT inhibitor in vitro.


Figures

Figure 1
Figure 1
LMD isolates PCs undergoing tumor progression in inflammatory peritoneal granulomas. (A-C) Low-power images (originally using 10× objective) of peritoneal OGs containing PCs analyzed at early (day 7), middle (day 39), and late (day 107) times after IP injection of 0.5 mL of pristane oil. Paraffin-embedded formalin-fixed tissues were sectioned and stained with Ab against mouse Ig κ light chains to identify PCs (red), and then counterstained with hematoxylin to identify stromal cells (blue). (D-K) Microscopic images of MGP-stained frozen sections of pristane granulomas at early (day 17), middle (days 33 and 46), and late (day 104) times after IP pristane before (D-G) and after (H-K) collection of PCs using LMD. The contours of the tissue fragments targeted by the laser beam are indicated by red lines in panels D through G. The actual tissue fragments collected by LMD came from the holes seen in panels H through K. Microscopic slides were read using an Olympus BX-51 Light Microscope equipped with UPLSAPO objectives (Olympus) of the following magnifications and numerical apertures: 10×, 0.4 (panels A-C); 20×, 0.75 (panels D,H,F,J); 40×, 0.95 (panels E,I,G,K). The imaging medium was air. The light temperature of the microscope bulb varied between 3000 and 3400 K. Images were acquired with the help of a DP2 digital camera (Olympus) and DP2-BSW imaging software (Olympus), saved as TIF (tagged image file) data files, and enhanced—with respect to brightness, contrast, and color balance—using the Adobe Photoshop CS2 Version 9.0.2 software (Adobe Systems Inc).
Figure 2
Figure 2
Gene expression changes during tumor progression in study 1 (initial study). (A) A Venn diagram showing the number of gene sets found to be significantly variable by ANOVA and BETR analysis of PC and OG samples. Overlap of genes from the different analyses and different samples is indicated. The list of gene sets revealed by ANOVA and BETR analysis of both gene sets, before removal of overlapping genes, can be found in supplemental Tables 1 through 4. (B) Venn diagrams that illustrate the gene subtraction approach used in this study. The ANOVA-revealed PC gene set (top left) consists of 2963 gene probes (red oval), 50 of which also occurred in the ANOVA-revealed OG gene set (blue cone). Thus, the corrected or subtracted ANOVA-PC gene set consists of 2913 gene probes. The same algorithm applies to the BETR-revealed PC gene set (bottom left), the BETR-revealed OG gene set (top right) and the ANOVA-revealed OG gene set (bottom right). (C-F) Heat maps of changing genes during tumor progression in LMD-isolated PC samples or nondissected, whole-tissue OG samples after removal of gene sets, as described in panel B. Differentially regulated genes identified by either ANOVA or BETR analyses were subjected to unsupervised hierarchical clustering. Up- and down-regulated genes are indicated by red and green, respectively. Time of tumor induction is indicated by colored squares and dendrograms below and above heat maps, respectively. N.B.: The day 46 OG samples are not included in the analyses shown here, because only 2 day 46 samples proved to be of suitable quality for analysis, and BETR analysis requires all groups to contain the same number of samples (3, in the case of samples for days 7, 17, 33 and 104).
Figure 3
Figure 3
Gene expression changes during tumor progression in study 2 (validation study). Samples were analyzed as in study 1. Venn diagram showing the number of gene sets found to be significantly variable by ANOVA and BETR analysis of PC (plasma cell) and oil granuloma (OG) samples. Overlap of genes from the different analyses and different samples is indicated. The list of gene sets revealed by ANOVA and BETR analysis of both gene sets, before removal of overlapping genes, can be found in supplemental Tables 5 through 8. (B) Venn diagrams that illustrate the gene subtraction approach used in this study. The ANOVA-revealed PC gene set (top left) consists of 1321 gene probes (red oval), 42 of which also occurred in the ANOVA-revealed OG gene set (blue cone). Thus, the corrected or subtracted ANOVA-PC-gene set consists of 1279 gene probes. The same algorithm applies to the BETR-revealed PC gene set (bottom left), the BETR-revealed OG gene set (top right) and the ANOVA-revealed OG gene set (bottom right). Panels C, D, E, and F present heat maps of changing genes during tumor progression in LMD-isolated PC samples or non-dissected, whole-tissue OG samples after removal of gene sets, as described in panel B. Differently regulated genes identified by either ANOVA or BETR analyses were subjected to unsupervised hierarchical clustering. Up- and down-regulated genes are indicated by red and green, respectively. Time of tumor induction is indicated by colored squares and dendrograms below and above heat maps, respectively.
Figure 4
Figure 4
Expression levels of 5 selected ANOVA-revealed PC genes are up-regulated in frank tumor cells compared with premalignant tumor precursors. Log2-transformed mean gene expression levels (horizontal lines) and individual gene expression levels (dots) at indicated times posttumor induction with pristane are plotted for study 1 (initial study) in the left column and study 2 (validation study) in the center column. The results of statistical comparisons (2-tailed t test) of mean expression levels of combined tumor precursor samples (□; days 7-46 in case of study 1 [n = 20]; days 7-49 in case of study 2 [n = 24]) and tumor samples (■; day 104 in case of study 1 [n = 5]; day 105 in case of study 2 [n = 6]) are indicated as P values in the right column. Bcl2l1 indicates BCL-2-like 1; Bmi, Bmi polycomb ring finger oncogene; Cxxc5, CXXC finger 5; Csk, c-src tyrosine kinase; and Ly6 days, lymphocyte Ag 6 complex, locus D.
Figure 5
Figure 5
Tumor progression–dependent changes are seen in Spp1 expression and in other genes in the Spp1 network. (A) The time course of the mean expression level of Spp1, secreted phosphoprotein 1 (better known as osteopontin) in the PC samples of study 1 (left) and study 2 (right). In both studies, the expression of Spp1 in frank tumor cells (days 104/105) was significantly lower (P < .05) than in tumor precursors, regardless which time of tumor induction (days 7-49) was used for t test analysis. (B) Ingenuity pathways analysis (IPA) comparisons of the Spp1-dependent gene network from study 1 on days 7 vs 17 (top row, left), days 7 vs 33 (center), days 7 vs 46 (right) and days 7 vs 104 (bottom row, right). Spp1 and Spp1-regulated target genes are in the center and periphery of network diagrams, respectively. Spp1 targets that were significantly up-regulated when the relatively high Spp1 level on day 7 exhibited further incremental increases (days 17-46) are highlighted in red to the bottom left: Rock2, Cxcl3, Cxcl6, EGFR, MMP9 (P < .001, > 3-fold differences). Spp1 targets that were significantly down-regulated in accordance with the drop in Spp1 levels on day 104 are highlighted in green (P < .001, > 3-fold differences). Note that 3 genes found to be up-regulated in earlier comparisons (Cxcl3, Cxcl6, Rock2) are now found to be significantly down-regulated. Similar results were obtained when the Spp1 network in study 2 was analyzed (not shown).
Figure 6
Figure 6
Metformin inhibits proliferation of PCT cells in vitro. (A) Top panel displays the dose-dependent decrease in the number of viable cells of the PC tumor line, XRPC24, after treatment with metformin. Cells were grown in vitro in presence of 3 different concentrations of metformin (1mM, 5mM, and 10mM) for 1, 2, or 3 days; then the number of cells was determined using the Cell Titer Blue assay. Statistical comparison of biologic replicates (n = 6) using a 2-tailed t test demonstrated the growth-inhibiting effect of metformin at all concentrations and time points compared with cells grown in absence of metformin (*P < .05). Metformin did not inhibit BM stroma cells, S-10 (bottom). (B) Inhibition of proliferation of PCT by metformin was confirmed in 3 additional lines of PCTs (ABPC20, AH2D11, TEPC2077) after 2 days in cell culture. Same conditions were used in all experiments.

Similar articles

Cited by

References

    1. Hanahan D, Weinberg RA. Hallmarks of cancer: the next generation. Cell. 2011;144(5):646–674. - PubMed
    1. Landgren O, Kyle RA, Pfeiffer RM, et al. Monoclonal gammopathy of undetermined significance (MGUS) consistently precedes multiple myeloma: a prospective study. Blood. 2009;113(22):5412–5417. - PMC - PubMed
    1. Weiss BM, Abadie J, Verma P, Howard RS, Kuehl WM. A monoclonal gammopathy precedes multiple myeloma in most patients. Blood. 2009;113(22):5418–5422. - PMC - PubMed
    1. Davies FE, Dring AM, Li C, et al. Insights into the multistep transformation of MGUS to myeloma using microarray expression analysis. Blood. 2003;102(13):4504–4511. - PubMed
    1. Zhan F, Hardin J, Kordsmeier B, et al. Global gene expression profiling of multiple myeloma, monoclonal gammopathy of undetermined significance, and normal bone marrow plasma cells. Blood. 2002;99(5):1745–1757. - PubMed

Publication types

MeSH terms