

Opposing effects of Runx2 and estradiol on breast cancer cell proliferation: in vitro identification of reciprocally regulated gene signature related to clinical letrozole responsiveness
- PMID: 22147940
- PMCID: PMC3277803
- DOI: 10.1158/1078-0432.CCR-11-1530
Opposing effects of Runx2 and estradiol on breast cancer cell proliferation: in vitro identification of reciprocally regulated gene signature related to clinical letrozole responsiveness
Abstract
Purpose: To assess the clinical significance of the interaction between estrogen and Runx2 signaling, previously shown in vitro.
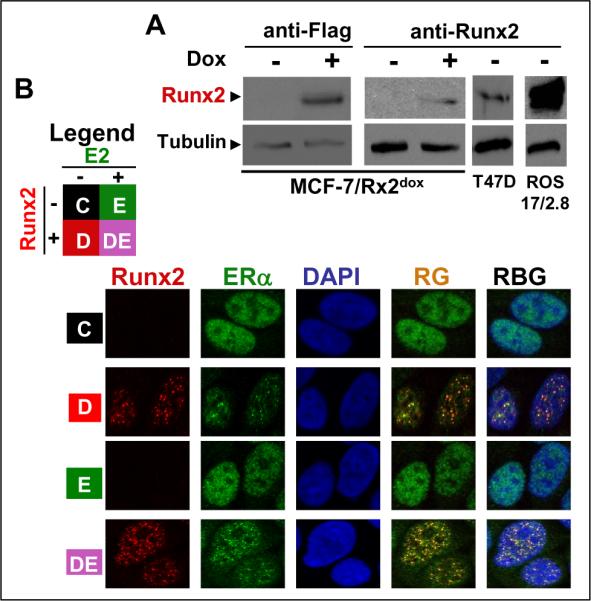
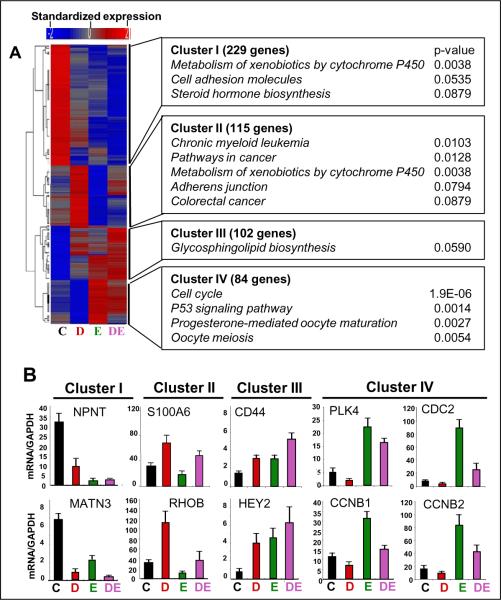
Experimental design: MCF7/Rx2(dox) breast cancer cells were treated with estradiol and/or doxycycline to induce Runx2, and global gene expression was profiled to define genes regulated by estradiol, Runx2, or both. Anchorage-independent growth was assessed by soft-agar colony formation assays. Expression of gene sets defined using the MCF7/Rx2(dox) system was analyzed in pre- and on-treatment biopsies from hormone receptor-positive patients undergoing neoadjuvant letrozole treatment in two independent studies, and short-term changes in gene expression were correlated with tumor size reduction or Ki67 index at surgery.
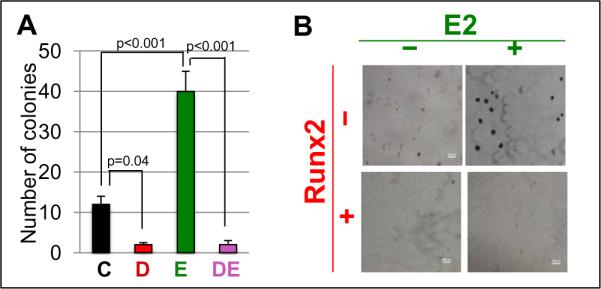
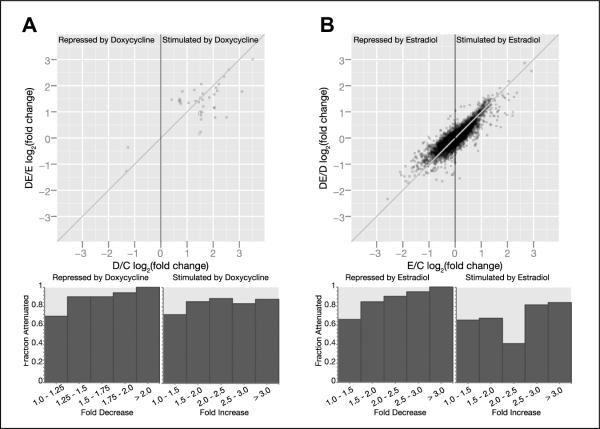
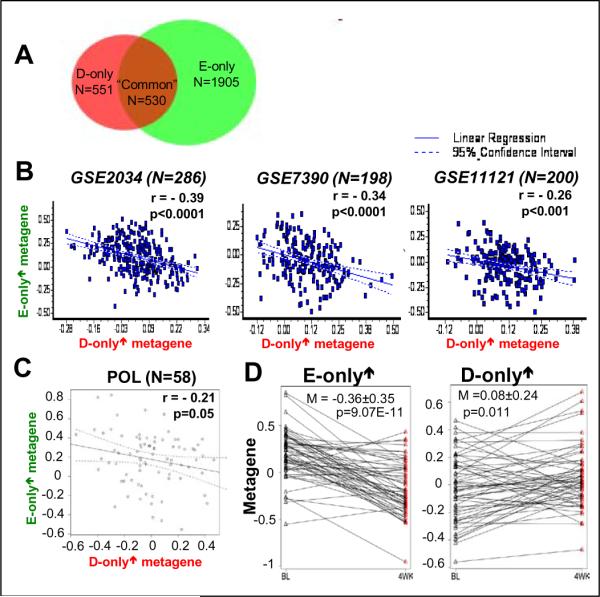
Results: Reflecting its oncogenic property, estradiol strongly promoted soft-agar colony formation, whereas Runx2 blocked this process suggesting tumor suppressor property. Transcriptome analysis of MCF7/Rx2(dox) cells treated with estradiol and/or doxycycline showed reciprocal attenuation of Runx2 and estrogen signaling. Correspondingly in breast cancer tumors, expression of estradiol- and Runx2-regulated genes was inversely correlated, and letrozole increased expression of Runx2-stimulated genes, as defined in the MCF7/Rx2(dox) model. Of particular interest was a gene set upregulated by estradiol and downregulated by Runx2 in vitro; its short-term response to letrozole treatment associated with tumor size reduction and Ki67 index at surgery better than other estradiol-regulated gene sets.
Conclusion: This work provides clinical evidence for the importance of antagonism between Runx2 and E2 signaling in breast cancer. Likely sensing the tension between them, letrozole responsiveness of a genomic node, positively regulated by estradiol and negatively regulated by Runx2 in vitro, best correlated with the clinical efficacy of letrozole treatment.
Figures
Similar articles
-
Regulation of breast cancer metastasis by Runx2 and estrogen signaling: the role of SNAI2.Breast Cancer Res. 2011;13(6):R127. doi: 10.1186/bcr3073. Epub 2011 Dec 9. Breast Cancer Res. 2011. PMID: 22151997 Free PMC article.
-
Low residual proliferation after short-term letrozole therapy is an early predictive marker of response in high proliferative ER-positive breast cancer.Endocr Relat Cancer. 2011 Nov 14;18(6):721-30. doi: 10.1530/ERC-11-0180. Print 2011 Dec. Endocr Relat Cancer. 2011. PMID: 21984694
-
Changes in expression of oestrogen regulated and proliferation genes with neoadjuvant treatment highlight heterogeneity of clinical resistance to the aromatase inhibitor, letrozole.Breast Cancer Res. 2010;12(4):R52. doi: 10.1186/bcr2611. Epub 2010 Jul 20. Breast Cancer Res. 2010. PMID: 20646288 Free PMC article. Clinical Trial.
-
Anti-tumor effects of letrozole.Cancer Invest. 2002;20 Suppl 2:15-21. doi: 10.1081/cnv-120014882. Cancer Invest. 2002. PMID: 12442345 Review.
-
Future directions in the treatment of hormone-sensitive advanced breast cancer: the RAD001 (Everolimus)-letrozole clinical program.Semin Oncol. 2006 Apr;33(2 Suppl 7):S18-25. doi: 10.1053/j.seminoncol.2006.03.024. Semin Oncol. 2006. PMID: 16730273 Review.
Cited by
-
Antitumor efficacy of the Runx2-dendritic cell vaccine in triple-negative breast cancer in vitro.Oncol Lett. 2018 Sep;16(3):2813-2822. doi: 10.3892/ol.2018.9001. Epub 2018 Jun 21. Oncol Lett. 2018. PMID: 30127867 Free PMC article.
-
Runx2 is required for activity of CD44+/CD24-/low breast cancer stem cell in breast cancer development.Am J Transl Res. 2020 May 15;12(5):2305-2318. eCollection 2020. Am J Transl Res. 2020. PMID: 32509221 Free PMC article.
-
Transcription factor RUNX2 up-regulates chemokine receptor CXCR4 to promote invasive and metastatic potentials of human gastric cancer.Oncotarget. 2016 Apr 12;7(15):20999-1012. doi: 10.18632/oncotarget.8236. Oncotarget. 2016. PMID: 27007162 Free PMC article.
-
RUNX2 as a promising therapeutic target for malignant tumors.Cancer Manag Res. 2021 Mar 16;13:2539-2548. doi: 10.2147/CMAR.S302173. eCollection 2021. Cancer Manag Res. 2021. PMID: 33758548 Free PMC article. Review.
-
Runx2 Expression as a Potential Prognostic Marker in Invasive Ductal Breast Carcinoma.Pathol Oncol Res. 2016 Jul;22(3):461-70. doi: 10.1007/s12253-015-0018-5. Epub 2015 Nov 23. Pathol Oncol Res. 2016. PMID: 26597806
References
-
- Butt AJ, McNeil CM, Musgrove EA, Sutherland RL. Downstream targets of growth factor and oestrogen signalling and endocrine resistance: the potential roles of c-Myc, cyclin D1 and cyclin E. Endocr Relat Cancer. 2005;12(Suppl 1):S47–59. - PubMed
-
- van't Veer LJ, Dai H, van de Vijver MJ, He YD, Hart AA, Mao M, et al. Gene expression profiling predicts clinical outcome of breast cancer. Nature. 2002;415:530–6. - PubMed
-
- Wang Y, Klijn JG, Zhang Y, Sieuwerts AM, Look MP, Yang F, et al. Gene-expression profiles to predict distant metastasis of lymph-node-negative primary breast cancer. Lancet. 2005;365:671–9. - PubMed
-
- Sotiriou C, Wirapati P, Loi S, Harris A, Fox S, Smeds J, et al. Gene expression profiling in breast cancer: understanding the molecular basis of histologic grade to improve prognosis. J Natl Cancer Inst. 2006;98:262–72. - PubMed
Publication types
MeSH terms
Substances
Grants and funding
LinkOut - more resources
Full Text Sources
Medical
Molecular Biology Databases
