Characteristics of body fat, body fat percentage and other body composition for Koreans from KNHANES IV
- PMID: 22147997
- PMCID: PMC3230020
- DOI: 10.3346/jkms.2011.26.12.1599
Characteristics of body fat, body fat percentage and other body composition for Koreans from KNHANES IV
Abstract
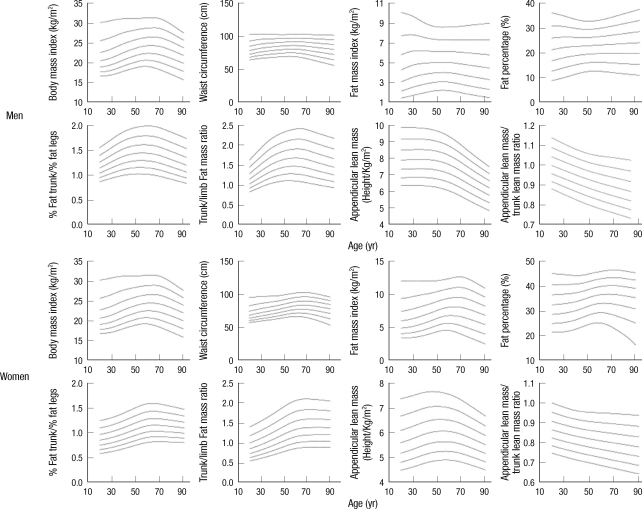
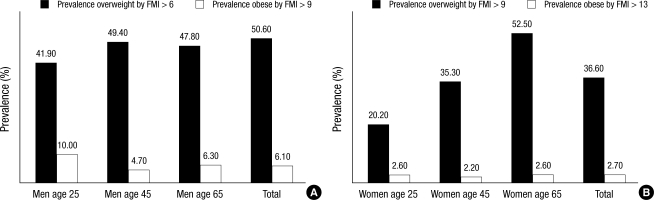
Accurate measurement of fat mass has become increasingly important with the increasing incidence of obesity. We assessed fat and muscle mass of Koreans with the Korea National Health and Nutrition Examination Survey IV (KNHANES IV). We studied 10,456 subjects (aged 20 to 85 yr; 4,476 men, 5,980 women). Fat and muscle mass were measured by dual-energy x-ray absorptiometry. Reference values of body compositions were obtained using the LMS method. The fat mass index (FMI, body fat mass/height(2); kg/m(2)) of Korean men did not correlate with age (P = 0.452), but those of Korean women (P < 0.001) did. The ratio of percentage of fat in the trunk and legs was positively related with age in both the genders. The appendicular lean mass/height(2) (kg/m(2)) of Korean men was negatively related to age (P < 0.001). In women, this ratio increased with age (P < 0.001). When we defined obesity according to the FMI classification, the rates of obesity were 6.1% (FMI > 9 kg/m(2)) in men and 2.7% (FMI > 13 kg/m(2)) in women. It is concluded that the muscle mass decreases and obesity increases with aging in Korean men, whereas both fat mass and obesity increase with aging in Korean women.
Keywords: Body composition; DXA; Korea; NHANES; Obesity; Sarcopenia.
Figures
Similar articles
-
Relationship between indices of obesity obtained by anthropometry and dual-energy X-ray absorptiometry: The Fourth and Fifth Korea National Health and Nutrition Examination Survey (KNHANES IV and V, 2008-2011).Obes Res Clin Pract. 2015 Sep-Oct;9(5):487-98. doi: 10.1016/j.orcp.2014.11.002. Epub 2014 Dec 4. Obes Res Clin Pract. 2015. PMID: 25484303
-
Different correlation of body mass index with body fatness and obesity-related biomarker according to age, sex and race-ethnicity.Sci Rep. 2023 Mar 1;13(1):3472. doi: 10.1038/s41598-023-30527-w. Sci Rep. 2023. PMID: 36859451 Free PMC article.
-
Sex- and age-specific percentiles of body composition indices for Chinese adults using dual-energy X-ray absorptiometry.Eur J Nutr. 2017 Oct;56(7):2393-2406. doi: 10.1007/s00394-016-1279-9. Epub 2016 Jul 29. Eur J Nutr. 2017. PMID: 27473103 Free PMC article.
-
Early Nutrition and Its Effect on Growth, Body Composition and Later Obesity.World Rev Nutr Diet. 2021;123:122-135. doi: 10.1159/000516440. Epub 2021 Aug 5. World Rev Nutr Diet. 2021. PMID: 34404055 Review. No abstract available.
-
Early Nutrition and Its Effect on Growth, Body Composition, and Later Obesity.World Rev Nutr Diet. 2022;125:138-155. doi: 10.1159/000521798. Epub 2022 Mar 4. World Rev Nutr Diet. 2022. PMID: 35249026 Review. No abstract available.
Cited by
-
Comparisons of different indices of low muscle mass in relationship with cardiometabolic disorder.Sci Rep. 2019 Jan 24;9(1):609. doi: 10.1038/s41598-018-37347-3. Sci Rep. 2019. PMID: 30679721 Free PMC article.
-
The Differential Effect of Excess Aldosterone on Skeletal Muscle Mass by Sex.Front Endocrinol (Lausanne). 2019 Mar 29;10:195. doi: 10.3389/fendo.2019.00195. eCollection 2019. Front Endocrinol (Lausanne). 2019. PMID: 30984113 Free PMC article.
-
Development and Validation of Osteoporosis Risk-Assessment Model for Korean Men.Yonsei Med J. 2016 Jan;57(1):187-96. doi: 10.3349/ymj.2016.57.1.187. Yonsei Med J. 2016. PMID: 26632400 Free PMC article.
-
Association of Change in Smoking Status and Subsequent Weight Change with Risk of Nonalcoholic Fatty Liver Disease.Gut Liver. 2023 Jan 15;17(1):150-158. doi: 10.5009/gnl220038. Epub 2022 Nov 3. Gut Liver. 2023. PMID: 36325764 Free PMC article.
-
Age- and sex-related trends in body composition among Beijing adults aged 20-60 years: a cross-sectional study.BMC Public Health. 2023 Aug 10;23(1):1519. doi: 10.1186/s12889-023-16459-0. BMC Public Health. 2023. PMID: 37563675 Free PMC article.
References
-
- Prentice AM. The emerging epidemic of obesity in developing countries. Int J Epidemiol. 2006;35:93–99. - PubMed
-
- WHO. Obesity: preventing and managing the global epidemic. Report of a WHO consultation. World Health Organ Tech Rep Ser. 2000;894:i–xii. 1–253. - PubMed
-
- Kennedy AP, Shea JL, Sun G. Comparison of the classification of obesity by BMI vs. dual-energy X-ray absorptiometry in the Newfoundland population. Obesity (Silver Spring) 2009;17:2094–2099. - PubMed
MeSH terms
LinkOut - more resources
Full Text Sources
Other Literature Sources
Medical