

Enzyme reactions in nanoporous, picoliter volume containers
- PMID: 22148720
- PMCID: PMC3264690
- DOI: 10.1021/ac202726n
Enzyme reactions in nanoporous, picoliter volume containers
Abstract
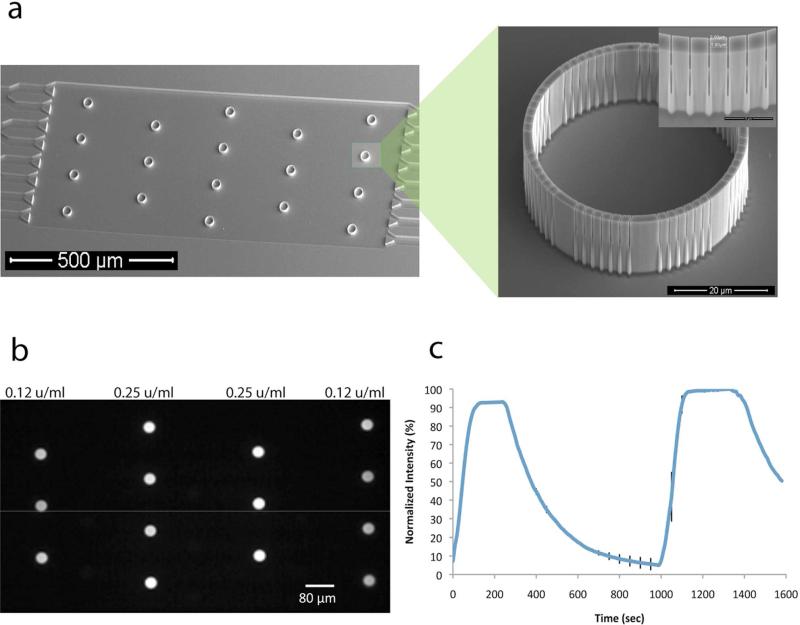
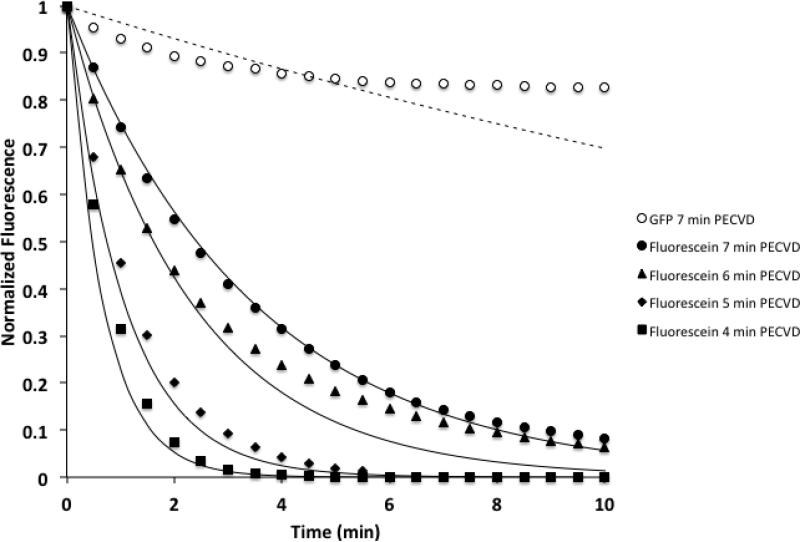
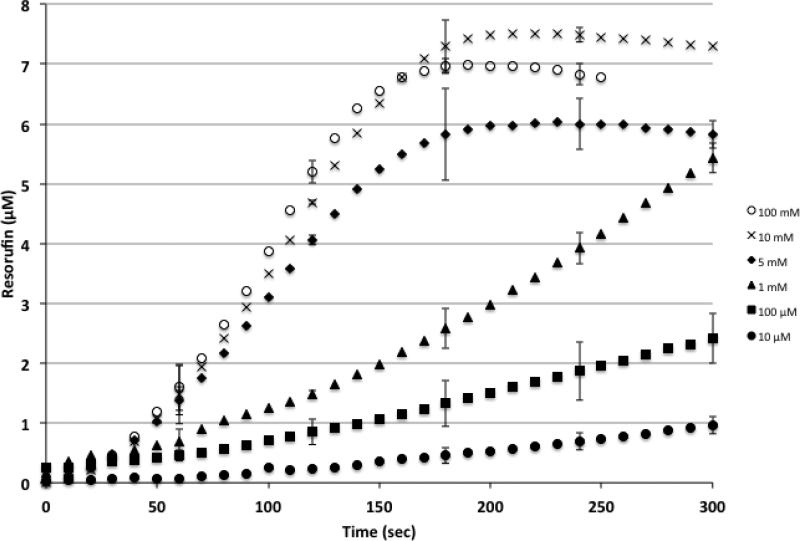
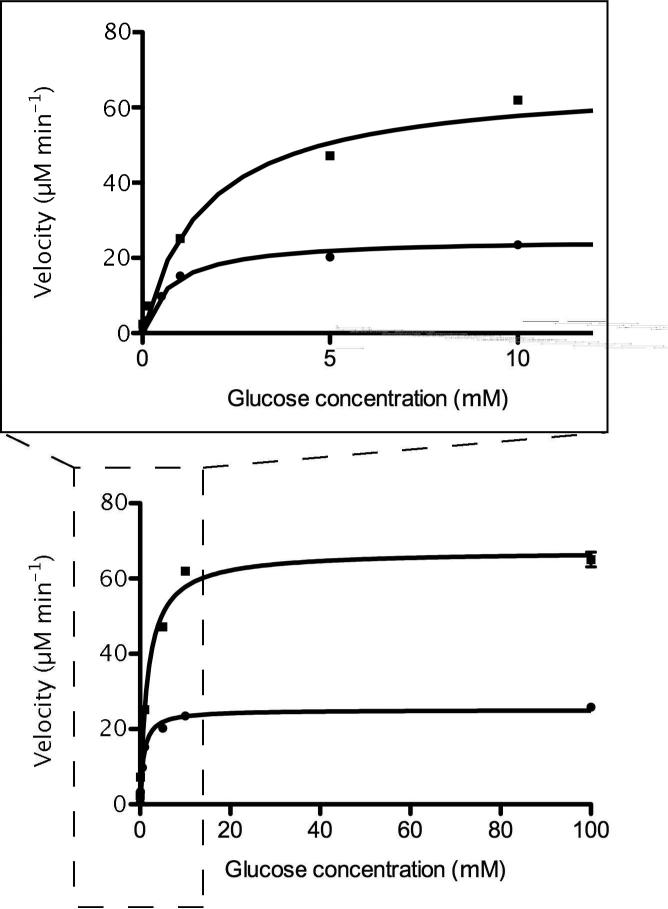
Advancements in nanoscale fabrication allow creation of small-volume reaction containers that can facilitate the screening and characterization of enzymes. A porous, ∼19 pL volume vessel has been used in this work to carry out enzyme reactions under varying substrate concentrations. Assessment of small-molecule and green fluorescent protein diffusion from the vessels indicates that pore sizes on the order of 10 nm can be obtained, allowing capture of proteins and diffusive exchange of small molecules. Glucose oxidase and horseradish peroxidase can be contained in these structures and diffusively fed with a solution containing glucose and the fluorogenic substrate amplex red through the engineered nanoscale pore structure. Fluorescent microscopy was used to monitor the reaction, which was carried out under microfluidic control. Kinetic characteristics of the enzyme (K(m) and V(max)) were evaluated and compared with results from conventional scale reactions. These picoliter, nanoporous containers can facilitate quick determination of enzyme kinetics in microfluidic systems without the requirement of surface tethering and can be used for applications in drug discovery, clinical diagnostics, and high-throughput screening.
Figures

Similar articles
-
Proximity does not contribute to activity enhancement in the glucose oxidase-horseradish peroxidase cascade.Nat Commun. 2016 Dec 22;7:13982. doi: 10.1038/ncomms13982. Nat Commun. 2016. PMID: 28004753 Free PMC article.
-
Measurement of enzyme kinetics using a continuous-flow microfluidic system.Anal Chem. 2003 Jul 1;75(13):3161-7. doi: 10.1021/ac034155b. Anal Chem. 2003. PMID: 12964765
-
Combined cross-linked enzyme aggregates of horseradish peroxidase and glucose oxidase for catalyzing cascade chemical reactions.Enzyme Microb Technol. 2017 May;100:52-59. doi: 10.1016/j.enzmictec.2017.02.007. Epub 2017 Feb 16. Enzyme Microb Technol. 2017. PMID: 28284312
-
Interenzyme substrate diffusion for an enzyme cascade organized on spatially addressable DNA nanostructures.J Am Chem Soc. 2012 Mar 28;134(12):5516-9. doi: 10.1021/ja300897h. Epub 2012 Mar 16. J Am Chem Soc. 2012. PMID: 22414276 Free PMC article.
-
Real-time assessment of spatial and temporal coupled catalysis within polyelectrolyte microcapsules containing coimmobilized glucose oxidase and peroxidase.Biomacromolecules. 2006 Mar;7(3):710-9. doi: 10.1021/bm050304j. Biomacromolecules. 2006. PMID: 16529405
Cited by
-
Fabrication of nanoporous membranes for tuning microbial interactions and biochemical reactions.J Vac Sci Technol B Nanotechnol Microelectron. 2015 Nov;33(6):06FM03. doi: 10.1116/1.4932671. Epub 2015 Oct 21. J Vac Sci Technol B Nanotechnol Microelectron. 2015. PMID: 26543684 Free PMC article.
-
Multi-input regulation and logic with T7 promoters in cells and cell-free systems.PLoS One. 2013 Oct 23;8(10):e78442. doi: 10.1371/journal.pone.0078442. eCollection 2013. PLoS One. 2013. PMID: 24194933 Free PMC article.
-
Interrogating the activities of conformational deformed enzyme by single-molecule fluorescence-magnetic tweezers microscopy.Proc Natl Acad Sci U S A. 2015 Nov 10;112(45):13904-9. doi: 10.1073/pnas.1506405112. Epub 2015 Oct 28. Proc Natl Acad Sci U S A. 2015. PMID: 26512103 Free PMC article.
References
-
- Urban PL, Goodall DM, Bruce NC. Enzymatic microreactors in chemical analysis and kinetic studies. Biotechnol Adv. 2006;24:42–57. - PubMed
-
- Welch GR, Somogyi B, Damjanovich S. The role of protein fluctuations in enzyme action: a review. Prog Biophys Mol Biol. 1982;39:109–146. - PubMed
-
- Colacino F, Crichton RR. Enzyme thermostabilization: the state of the art. Biotechnol Genet Eng Rev. 1997;14:211–277. - PubMed
-
- Girelli AM, Mattei E. Application of immobilized enzyme reactor in on-line high performance liquid chromatography: a review. J Chromatogr B Analyt Technol Biomed Life Sci. 2005;819:3–16. - PubMed
Publication types
MeSH terms
Substances
Grants and funding
LinkOut - more resources
Full Text Sources
Other Literature Sources
