. 2012 Jan 18;134(2):979-87.
doi: 10.1021/ja206557y. Epub 2011 Dec 27.

Effects of pH on proteins: predictions for ensemble and single-molecule pulling experiments

Affiliations

Effects of pH on proteins: predictions for ensemble and single-molecule pulling experiments

Edward P O'Brien et al. J Am Chem Soc. .

Abstract

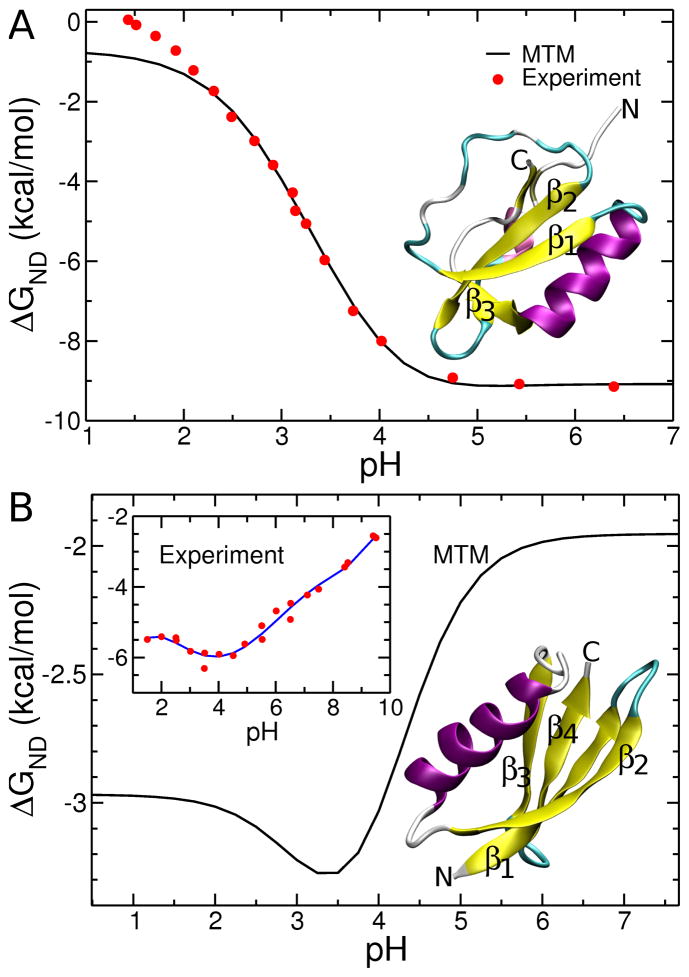
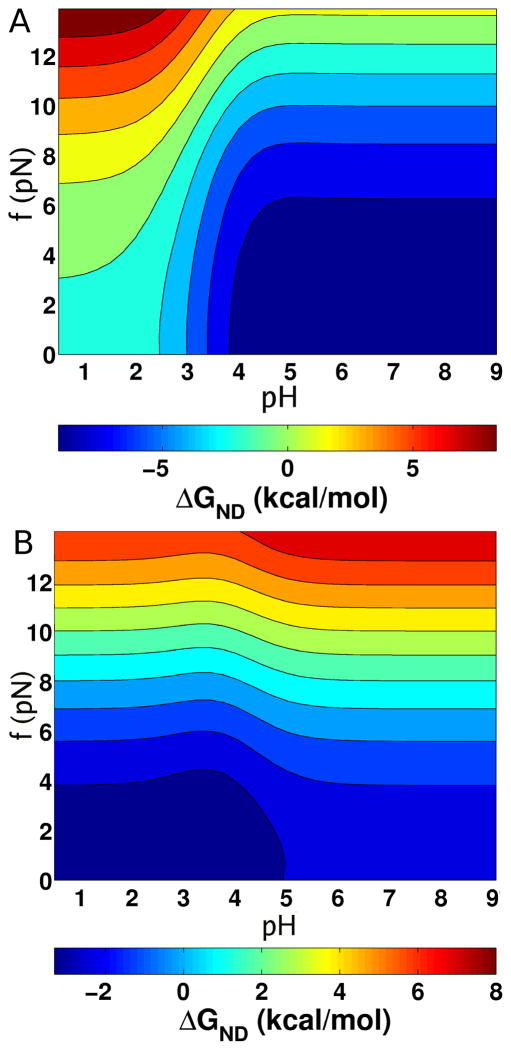
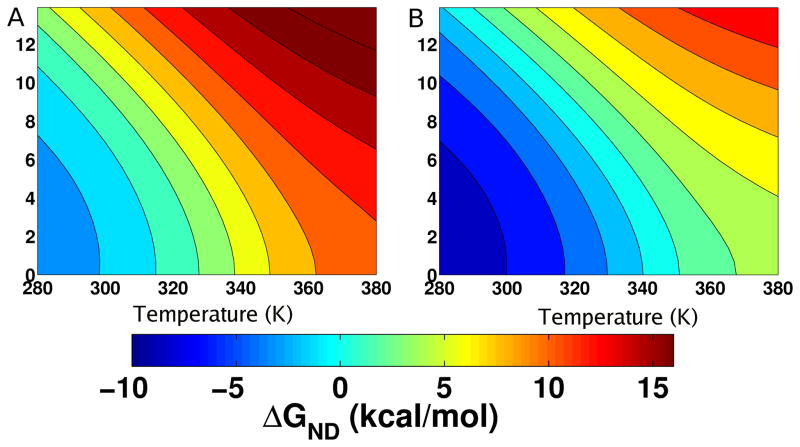
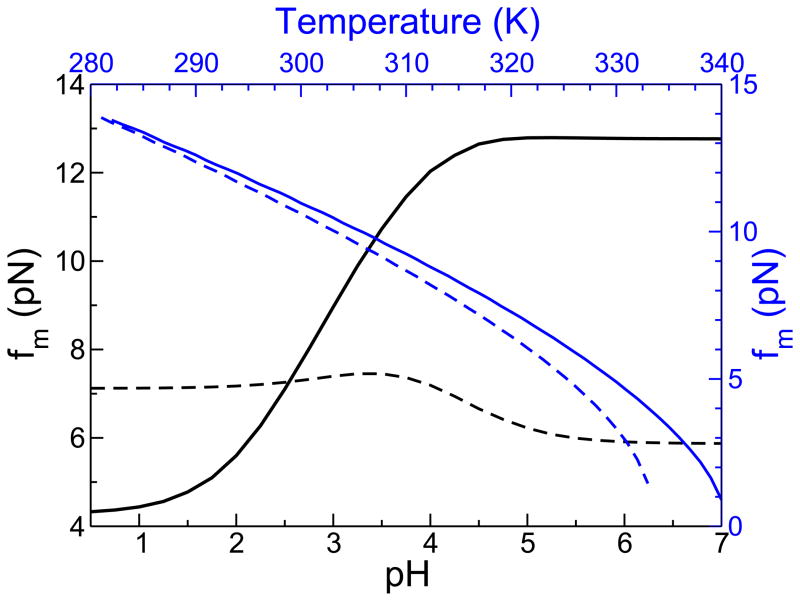
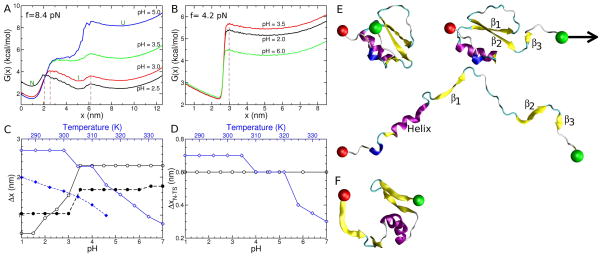
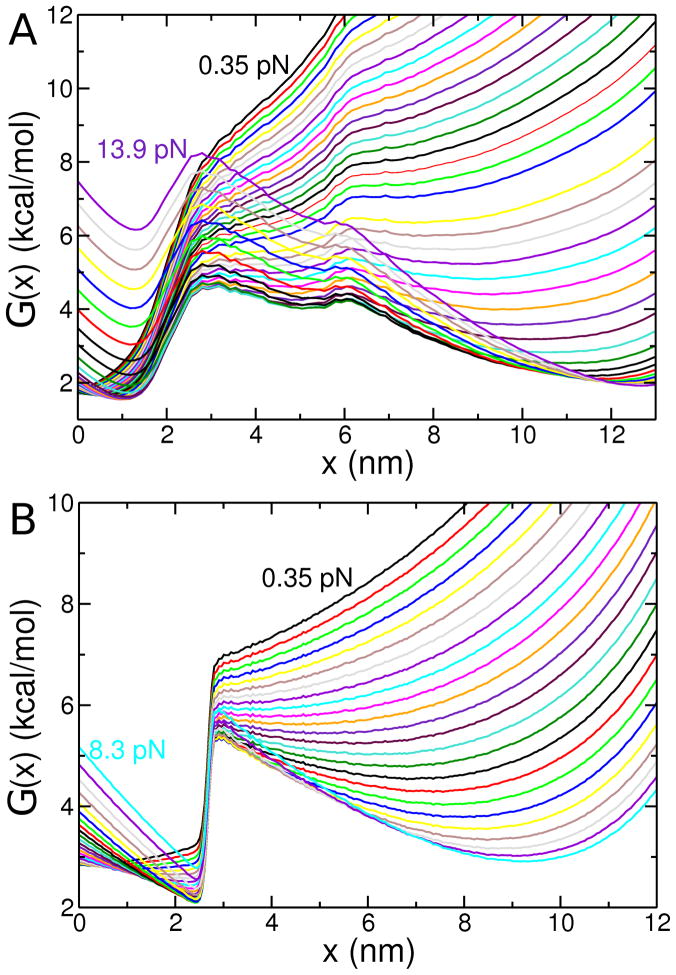
Protein conformations change among distinct thermodynamic states as solution conditions (temperature, denaturants, pH) are altered or when they are subjected to mechanical forces. A quantitative description of the changes in the relative stabilities of the various thermodynamic states is needed to interpret and predict experimental outcomes. We provide a framework based on the Molecular Transfer Model (MTM) to account for pH effects on the properties of globular proteins. The MTM utilizes the partition function of a protein calculated from molecular simulations at one set of solution conditions to predict protein properties at another set of solution conditions. To take pH effects into account, we utilized experimentally measured pK(a) values in the native and unfolded states to calculate the free energy of transferring a protein from a reference pH to the pH of interest. We validate our approach by demonstrating that the native-state stability as a function of pH is accurately predicted for chymotrypsin inhibitor 2 (CI2) and protein G. We use the MTM to predict the response of CI2 and protein G subjected to a constant force (f) and varying pH. The phase diagrams of CI2 and protein G as a function of f and pH are dramatically different and reflect the underlying pH-dependent stability changes in the absence of force. The calculated equilibrium free energy profiles as functions of the end-to-end distance of the two proteins show that, at various pH values, CI2 unfolds via an intermediate when subjected to f. The locations of the two transition states move toward the more unstable state as f is changed, which is in accord with the Hammond-Leffler postulate. In sharp contrast, force-induced unfolding of protein G occurs in a single step. Remarkably, the location of the transition state with respect to the folded state is independent of f, which suggests that protein G is mechanically brittle. The MTM provides a natural framework for predicting the outcomes of ensemble and single-molecule experiments for a wide range of solution conditions.


Figures

Figure 1
Figure 1
Stability of the native state, relative to the denatured state ensemble (ΔGND = −kBTln(PN/PD), where PN and PD are the probabilities of being in the native and denatured ensembles, respectively) as a function of pH. Panel A is for CI2 and B is for protein G. Native state structures are shown of CI2 and protein G in a secondary structure representation based on crystal structures with PDB accession codes of 2CI2 and 1GB1 respectively. Experimental data (red circles) in A are from. Because experimental data for wild-type protein G is unavailable we show in the inset in B experimental data (red circles) for a triple mutant protein G (T2Q, N8D, N37D). The blue line is a 5th order polynomial fit to the data and is used to guide the eye. For the CI2 the temperature in the simulations was 302 K and in the experiment was 298 K. For the protein G the simulation temperature was 317 K and in the experiment it was 298 K.
Figure 2
Figure 2
Force-pH phase diagram. (A) The [f, pH] diagram displays ΔGND(f, pH) for CI2 at a simulation temperature of 302 K. The solid lines correspond to lines of iso-stability. The scale for ΔGND(f, pH) is given below. (B) Same as (A) except it is for protein G at a simulation temperature of 317 K.
Figure 3
Figure 3
Force-temperature phase diagram for CI2. (A) Contours of this phase diagram at pH=1.0 are lines of iso-stability in ΔGND(f,T). Blue regions correspond to a thermodynamically stable native state while red corresponds to the unfolded state. (B) The [f,T] diagram is for pH=3.5. Enhanced stability at higher pH is reflected in large [f,T] regions in which the native state is stable.
Figure 4
Figure 4
The force midpoint at various temperatures and pH. The temperature scale is on top in blue and the corresponding scale for fm is on the right. Solid lines are for CI2 and the dotted lines are for protein G, with blue corresponding to temperature and black to pH changes. Unless otherwise stated, the solution conditions for CI2 are 302 K and pH 3.5, and for protein G the conditions are 317 K and pH 2.3.
Figure 5
Figure 5
pH and temperature effects on the mechanical response of CI2 and protein G at a constant tension force of 8.4 pN and 4.2 pN, respectively. The free energy profile G(x) = −kBTln(P(x)), where P(x) is the probability of finding a given x value, as a function of the end-to-end distance of the protein, projected onto the pulling vector, for (A) CI2 and (B) protein G at different pH values as labeled. The temperature is 302 K and 317 K in (A) and (B), respectively. Brown dashed lines indicate transition state locations at pH=2.5 and 3.0 in (A), and pH=3.5 in (B). The location of the native, intermediate, and fully unfolded basins of attraction in G(x) are marked by the labels N, I, and U, respectively. (C) For CI2, the distance, Δx, between the native and first transition state (ΔxN–TS), and intermediate and second transition state (ΔxI–TS) are shown as a function of pH (lower axis) and temperature (upper axis). The black symbols correspond to pH and blue symbols are for temperature. In both cases solid lines show ΔxN–TS and dashed lines correspond to ΔxI–TS. (D) Same as (C) but for protein G. No intermediate basin of attraction exists for protein G, so only the distance between the native and transition state (ΔxN–TS) is reported. (E) Sample conformations (top to bottom) from the native, intermediate and unfolded states of CI2 during simulations at 300 K and f = 8.68 pN. β-strands 1 through 3 are labeled and the direction in which the constant tension is applied to the C-terminus (green sphere) is indicated by the black arrow. The N-terminal residue, fixed in space during the simulation is shown as a red sphere. (F) Simulation structure of protein G with x=3.09 nm from the replica at T=320 K and f = 4.1 pN in the replica exchange simulations.
Figure 6
Figure 6
Equilibrium free energy profiles G(x) at various constant tension forces at pH 3.5 for (A) CI2 at 302 K and (B) protein G at 317 K. As indicated in the panels, the force values range from 0.35 pN up to 13 pN for CI2 and from 0.35 pN 8.3 pN for protein G. Successive profiles differ by approximately 0.35 pN of applied tension. Comparisons between (A) and (B) reveal vividly the dramatic differences in the compliance between these two proteins, thus underscoring the importance of native structure.

Similar articles

Cited by

References

    1. Schuler B, Eaton WA. Curr Opin Struc Biol. 2008;18:16–26. - PMC - PubMed
    1. Borgia A, Williams PM, Clarke J. Annu Rev Biochem. 2008;77:101–125. - PubMed
    1. Camacho CJ, Thirumalai D. Proc Natl Acad Sci USA. 1993;90:6369–6372. - PMC - PubMed
    1. Cecconi C, Shank EA, Bustamante C, Marqusee S. Science. 2005;309:2057–2060. - PubMed
    1. Bertz M, Wilmanns M, Rief M. Proc Natl Acad Sci USA. 2009;106:13307–13310. - PMC - PubMed

Publication types