

An integrated stochastic model of "inside-out" integrin activation and selective T-lymphocyte recruitment
- PMID: 22149624
- PMCID: PMC3269544
- DOI: 10.1021/la203803e
An integrated stochastic model of "inside-out" integrin activation and selective T-lymphocyte recruitment
Abstract
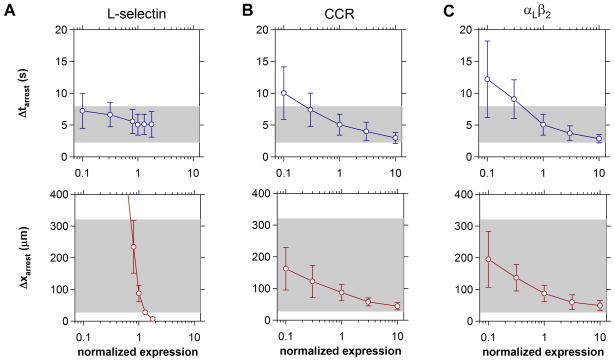
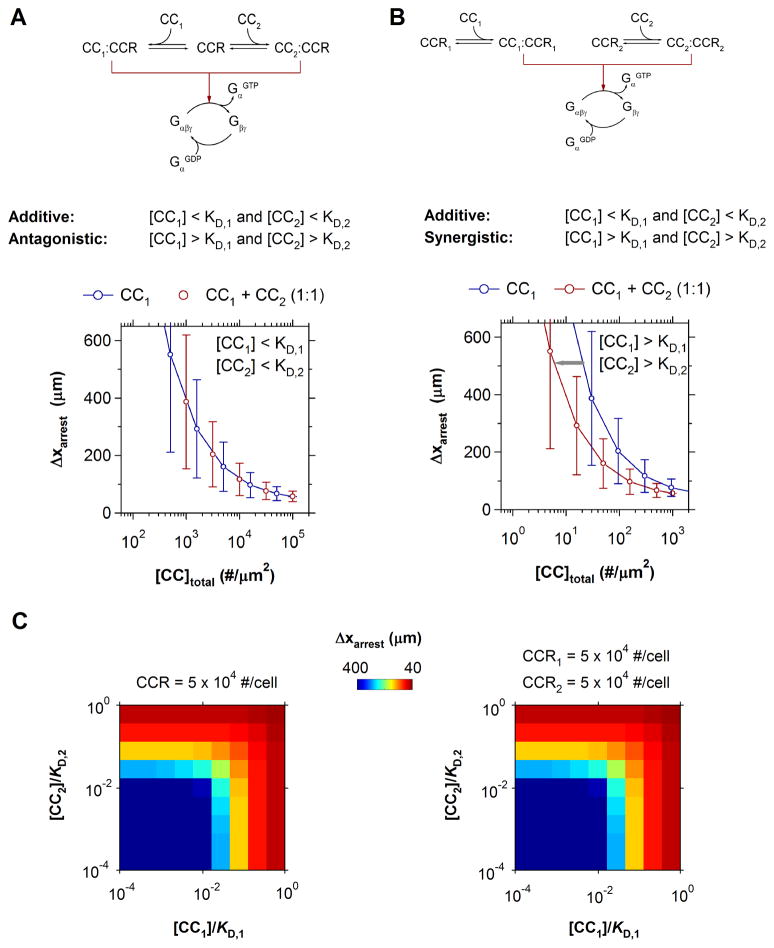
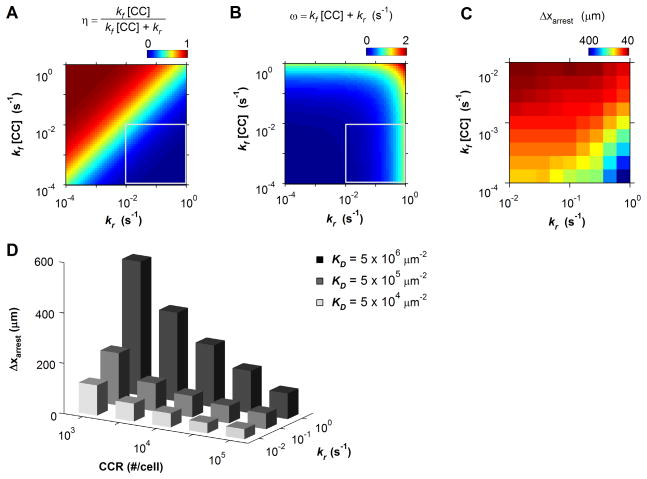
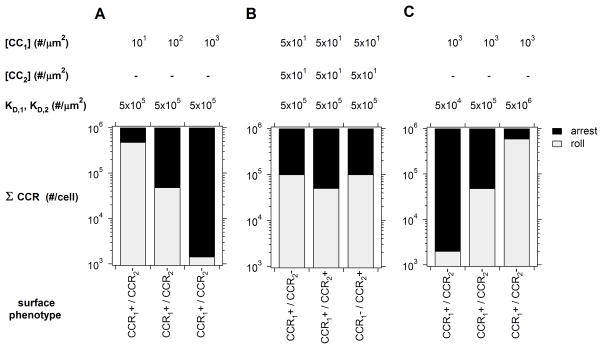
The pattern of T-lymphocyte homing is hypothesized to be controlled by combinations of chemokine receptors and complementary chemokines. Here, we use numerical simulation to explore the relationship among chemokine potency and concentration, signal transduction, and adhesion. We have developed a form of adhesive dynamics-a mechanically accurate stochastic simulation of adhesion-that incorporates stochastic signal transduction using the next subvolume method. We show that using measurable parameter estimates derived from a variety of sources, including signaling measurements that allow us to test parameter values, we can readily simulate approximate time scales for T-lymphocyte arrest. We find that adhesion correlates with total chemokine receptor occupancy, not the frequency of occupation, when multiple chemokine receptors feed through a single G-protein. A general strategy for selective T-lymphocyte recruitment appears to require low affinity chemokine receptors. For a single chemokine receptor, increases in multiple cross-reactive chemokines can lead to an overwhelming increase in adhesion. Overall, the methods presented here provide a predictive framework for understanding chemokine control of T-lymphocyte recruitment.
© 2011 American Chemical Society
Figures
Similar articles
-
Subsecond induction of alpha4 integrin clustering by immobilized chemokines stimulates leukocyte tethering and rolling on endothelial vascular cell adhesion molecule 1 under flow conditions.J Exp Med. 2000 Aug 21;192(4):495-506. doi: 10.1084/jem.192.4.495. J Exp Med. 2000. PMID: 10952719 Free PMC article.
-
Adhesive dynamics simulation of G-protein-mediated chemokine-activated neutrophil adhesion.Biophys J. 2009 Apr 22;96(8):2989-3004. doi: 10.1016/j.bpj.2008.12.3930. Biophys J. 2009. PMID: 19383446 Free PMC article.
-
Potential role of the chemokine receptors CXCR3, CCR4, and the integrin alphaEbeta7 in the pathogenesis of psoriasis vulgaris.Lab Invest. 2001 Mar;81(3):335-47. doi: 10.1038/labinvest.3780242. Lab Invest. 2001. PMID: 11310827
-
T cell integrin activation by chemokines in inflammation.Arch Immunol Ther Exp (Warsz). 2000;48(6):443-50. Arch Immunol Ther Exp (Warsz). 2000. PMID: 11197597 Review.
-
Novel chemokine functions in lymphocyte migration through vascular endothelium under shear flow.J Leukoc Biol. 2001 Jun;69(6):860-6. J Leukoc Biol. 2001. PMID: 11404368 Review.
Cited by
-
Adhesive dynamics simulations quantitatively predict effects of kindlin-3 deficiency on T-cell homing.Integr Biol (Camb). 2019 Jun 1;11(6):293-300. doi: 10.1093/intbio/zyz024. Integr Biol (Camb). 2019. PMID: 31329860 Free PMC article.
-
Human Neutrophils Will Crawl Upstream on ICAM-1 If Mac-1 Is Blocked.Biophys J. 2019 Oct 15;117(8):1393-1404. doi: 10.1016/j.bpj.2019.08.044. Epub 2019 Sep 18. Biophys J. 2019. PMID: 31585707 Free PMC article.
-
Immobilized IL-8 Triggers Phagocytosis and Dynamic Changes in Membrane Microtopology in Human Neutrophils.Ann Biomed Eng. 2015 Sep;43(9):2207-19. doi: 10.1007/s10439-014-1242-y. Epub 2015 Jan 13. Ann Biomed Eng. 2015. PMID: 25582838 Free PMC article.
-
Migration against the direction of flow is LFA-1-dependent in human hematopoietic stem and progenitor cells.J Cell Sci. 2018 Jan 10;131(1):jcs205575. doi: 10.1242/jcs.205575. J Cell Sci. 2018. PMID: 29180515 Free PMC article.
-
Adhesive dynamics.J Biomech Eng. 2014 Feb;136(2):021006. doi: 10.1115/1.4026402. J Biomech Eng. 2014. PMID: 24384944 Free PMC article. Review.
References
-
- Butcher EC, Picker LJ. Lymphocyte homing and homeostasis. Science. 1996;272:60–66. - PubMed
-
- Butcher EC. Leukocyte-endothelial cell recognition: three (or more) steps to specificity and diversity. Cell. 1991;67:1033–1036. - PubMed
-
- Laudanna C, Kim JY, Constantin G, Butcher E. Rapid leukocyte integrin activation by chemokines. Immunol Rev. 2002;186:37–46. - PubMed
-
- Kinashi T. Intracellular signalling controlling integrin activation in lymphocytes. Nat Rev Immunol. 2005;5:546–559. - PubMed
Publication types
MeSH terms
Substances
Grants and funding
LinkOut - more resources
Full Text Sources
