

Automated image-based colon cleansing for laxative-free CT colonography computer-aided polyp detection
- PMID: 22149845
- PMCID: PMC3254579
- DOI: 10.1118/1.3662918
Automated image-based colon cleansing for laxative-free CT colonography computer-aided polyp detection
Abstract
Purpose: To evaluate the performance of a computer-aided detection (CAD) system for detecting colonic polyps at noncathartic computed tomography colonography (CTC) in conjunction with an automated image-based colon cleansing algorithm.
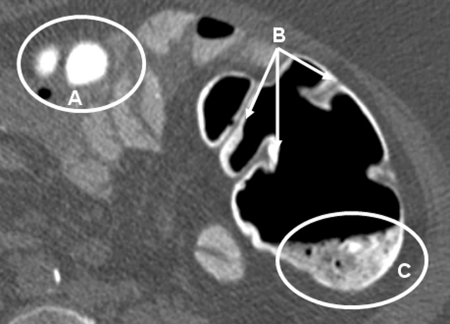
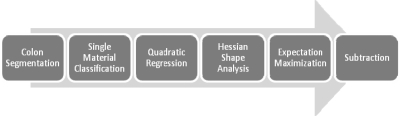
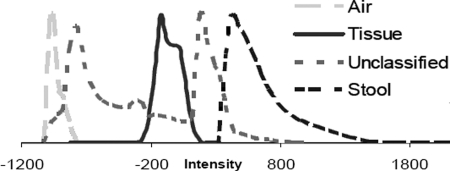
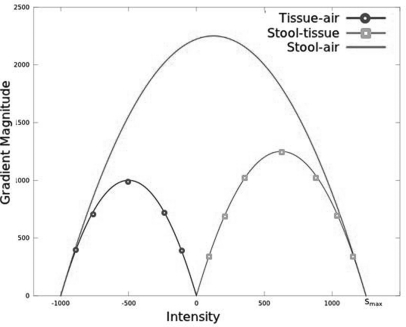
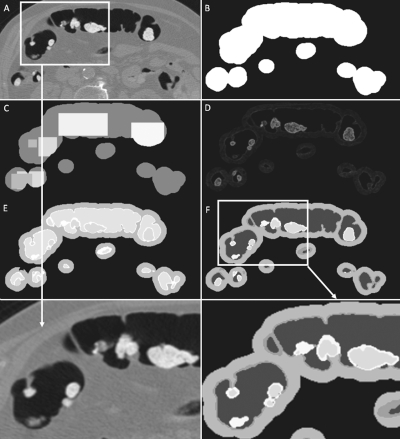
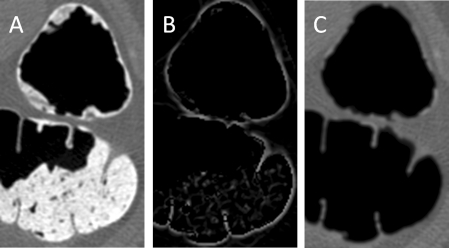
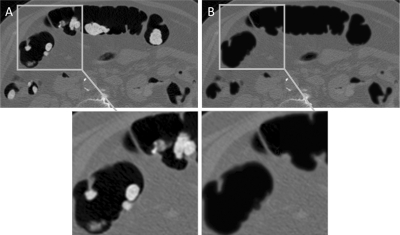
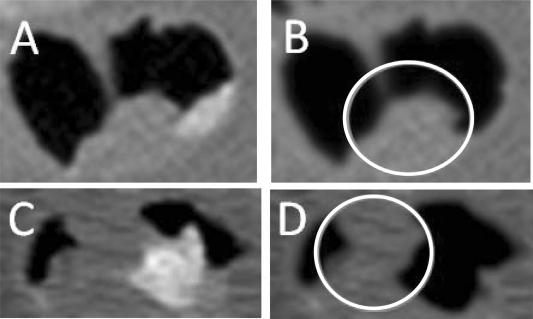
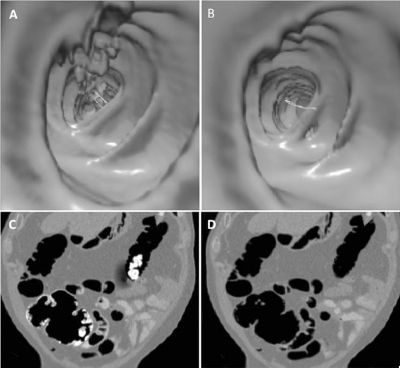
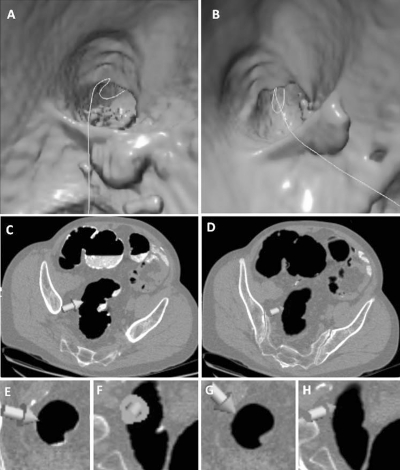
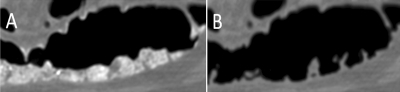
Methods: An automated colon cleansing algorithm was designed to detect and subtract tagged-stool, accounting for heterogeneity and poor tagging, to be used in conjunction with a colon CAD system. The method is locally adaptive and combines intensity, shape, and texture analysis with probabilistic optimization. CTC data from cathartic-free bowel preparation were acquired for testing and training the parameters. Patients underwent various colonic preparations with barium or Gastroview in divided doses over 48 h before scanning. No laxatives were administered and no dietary modifications were required. Cases were selected from a polyp-enriched cohort and included scans in which at least 90% of the solid stool was visually estimated to be tagged and each colonic segment was distended in either the prone or supine view. The CAD system was run comparatively with and without the stool subtraction algorithm.
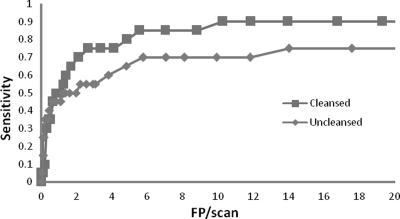
Results: The dataset comprised 38 CTC scans from prone and/or supine scans of 19 patients containing 44 polyps larger than 10 mm (22 unique polyps, if matched between prone and supine scans). The results are robust on fine details around folds, thin-stool linings on the colonic wall, near polyps and in large fluid/stool pools. The sensitivity of the CAD system is 70.5% per polyp at a rate of 5.75 false positives/scan without using the stool subtraction module. This detection improved significantly (p = 0.009) after automated colon cleansing on cathartic-free data to 86.4% true positive rate at 5.75 false positives/scan.
Conclusions: An automated image-based colon cleansing algorithm designed to overcome the challenges of the noncathartic colon significantly improves the sensitivity of colon CAD by approximately 15%.
Figures
Similar articles
-
Mixture of expert 3D massive-training ANNs for reduction of multiple types of false positives in CAD for detection of polyps in CT colonography.Med Phys. 2008 Feb;35(2):694-703. doi: 10.1118/1.2829870. Med Phys. 2008. PMID: 18383691
-
Performance of a previously validated CT colonography computer-aided detection system in a new patient population.AJR Am J Roentgenol. 2008 Jul;191(1):168-74. doi: 10.2214/AJR.07.3354. AJR Am J Roentgenol. 2008. PMID: 18562741
-
Registration of central paths and colonic polyps between supine and prone scans in computed tomography colonography: pilot study.Med Phys. 2004 Oct;31(10):2912-23. doi: 10.1118/1.1796171. Med Phys. 2004. PMID: 15543800 Clinical Trial.
-
CT colonography with computer-aided detection: recognizing the causes of false-positive reader results.Radiographics. 2014 Nov-Dec;34(7):1885-905. doi: 10.1148/rg.347130053. Radiographics. 2014. PMID: 25384290 Free PMC article. Review.
-
Computer-aided detection for CT colonography: update 2007.Abdom Imaging. 2007 Sep-Oct;32(5):571-81. doi: 10.1007/s00261-007-9293-2. Abdom Imaging. 2007. PMID: 17690932 Review.
Cited by
-
Volumetric detection of colorectal lesions for noncathartic dual-energy computed tomographic colonography.Annu Int Conf IEEE Eng Med Biol Soc. 2012;2012:3740-3. doi: 10.1109/EMBC.2012.6346780. Annu Int Conf IEEE Eng Med Biol Soc. 2012. PMID: 23366741 Free PMC article. Clinical Trial.
-
Electronic cleansing in computed tomography colonography using AT layer identification with integration of gradient directional second derivative and material fraction model.BMC Med Imaging. 2017 Sep 4;17(1):53. doi: 10.1186/s12880-017-0224-6. BMC Med Imaging. 2017. PMID: 28870147 Free PMC article.
-
Informatics in radiology: dual-energy electronic cleansing for fecal-tagging CT colonography.Radiographics. 2013 May;33(3):891-912. doi: 10.1148/rg.333125039. Epub 2013 Mar 11. Radiographics. 2013. PMID: 23479680 Free PMC article. Review.
-
Self-Supervised Adversarial Learning with a Limited Dataset for Electronic Cleansing in Computed Tomographic Colonography: A Preliminary Feasibility Study.Cancers (Basel). 2022 Aug 26;14(17):4125. doi: 10.3390/cancers14174125. Cancers (Basel). 2022. PMID: 36077662 Free PMC article.
References
Publication types
MeSH terms
Substances
Grants and funding
LinkOut - more resources
Full Text Sources
Medical
Miscellaneous
