. 2012 Mar 15;442(3):539-50.
doi: 10.1042/BJ20111678.

Reprogramming of pancreatic exocrine cells towards a beta (β) cell character using Pdx1, Ngn3 and MafA

Affiliations

Reprogramming of pancreatic exocrine cells towards a beta (β) cell character using Pdx1, Ngn3 and MafA

Ersin Akinci et al. Biochem J. .

Abstract

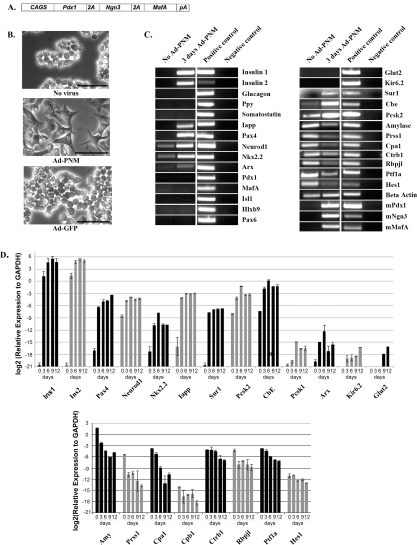
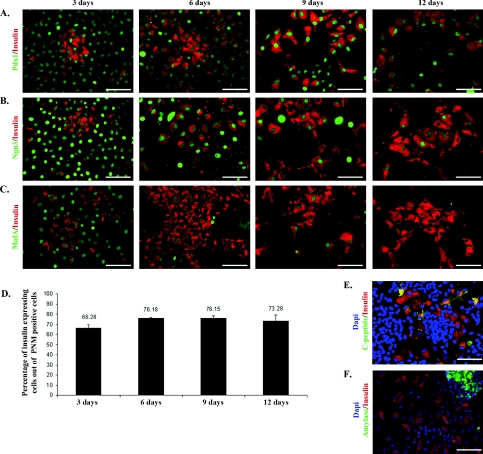
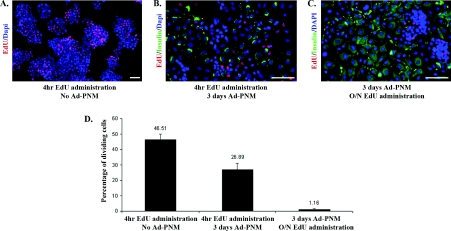
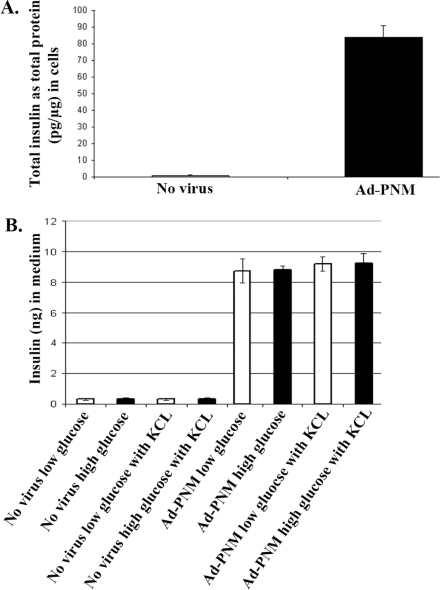
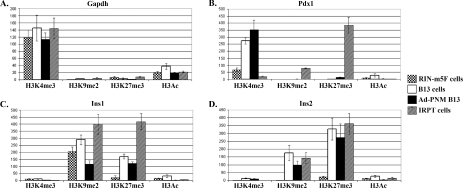
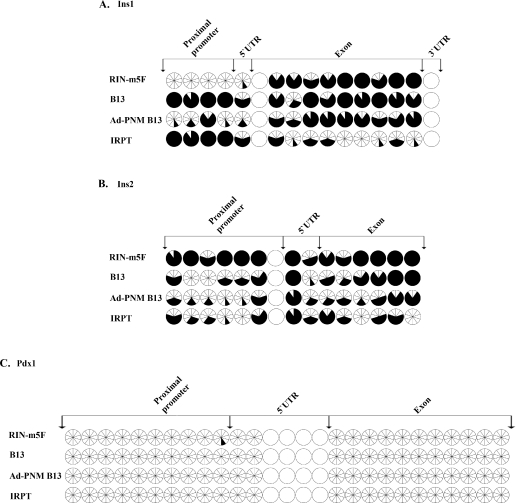
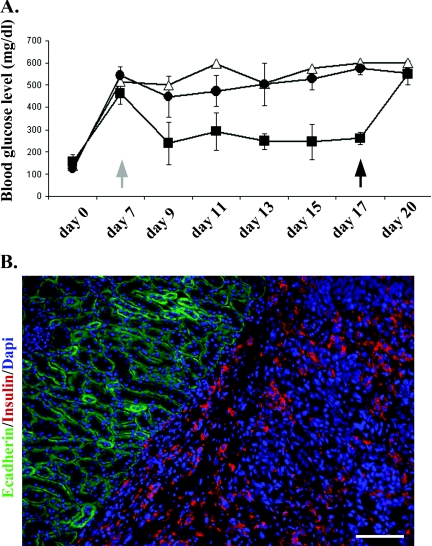
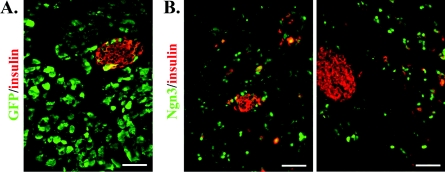
Pdx1 (pancreatic and duodenal homeobox 1), Ngn3 (neurogenin 3) and MafA (v-maf musculoaponeurotic fibrosarcoma oncogene family, protein A) have been reported to bring about the transdifferentiation of pancreatic exocrine cells to beta (β) cells in vivo. We have investigated the mechanism of this process using a standard in vitro model of pancreatic exocrine cells, the rat AR42j-B13 cell line. We constructed a new adenoviral vector encoding all three genes, called Ad-PNM (adenoviral Pdx1, Ngn3, MafA construct). When introduced into AR42j-B13 cells, Ad-PNM caused a rapid change to a flattened morphology and a cessation of cell division. The expression of exocrine markers is suppressed. Both insulin genes are up-regulated as well as a number of transcription factors normally characteristic of beta cells. At the chromatin level, histone tail modifications of the Pdx1, Ins1 (insulin 1) and Ins2 (insulin 2) gene promoters are shifted in a direction associated with gene activity, and the level of DNA CpG methylation is reduced at the Ins1 promoter. The transformed cells secrete insulin and are capable of relieving diabetes in streptozotocin-treated NOD-SCID (non-obese diabetic severe combined immunodeficiency) mice. However the transformation is not complete. The cells lack expression of several genes important for beta cell function and they do not show glucose-sensitive insulin secretion. We conclude that, for this exocrine cell model, although the transformation is dramatic, the reprogramming is not complete and lacks critical aspects of the beta cell phenotype.


Figures

Figure 1
Figure 1. Effect of PNM on cell shape and gene expression profile of B13 cells
(A) Diagram of the Ad-PNM construct. CAGS, cytomegalovirus-chicken β-actin. (B) Shape of the B13 cells with no treatment, Ad-PNM or Ad-GFP. Images were taken 3 days after virus transduction. Scale bars=100 μm. (C) Changes in the gene expression profile of B13 cells, with and without Ad-PNM, by RT–PCR. From left to right the lanes are as follows: untreated B13 cells, B13 cells 3 days after Ad-PNM, positive control sample and water (negative control). Input gene expression is labelled as mPdx1, mNgn3 and mMafA. Each horizontal strip comes from a single gel but different strips may come from different gels. The results for Abcc8/Sur1, Prss1, Cpa1, Ctrb1 and Rbpjl were obtained with the qRT–PCR primers. (D) Changes in the gene expression profile of B13 cells, with and without Ad-PNM, by qRT–PCR. From left to right the bars are as follows: untreated B13 cells as day 0, Ad-PNM-treated B13 cells as day 3, day 6, day 9 and day 12. Cultures were kept in araC to remove untransduced B13 cells. The heights of bars shows the expression relative to the housekeeping gene Gapdh. Results are means±S.E.M. (n=3).
Figure 2
Figure 2. Expression of insulin and exogenous Pdx1, Ngn3, MafA
B13 cells were fixed and stained 3, 6, 9, 12 days after Ad-PNM transduction. Cells were then co-stained for insulin (red) and Pdx1 (green) (A), insulin (red) and Ngn3 (green) (B), insulin (red) and MafA (green) (C). (D) Percentage of insulin-positive cells out of the population of PNM-positive cells. Data are means±S.E.M. (n=3). (E) C-peptide (green), insulin (red) and DAPI (blue) at day 12. (F) Amylase (green), insulin (red) and DAPI (blue) at day 6. Scale bars=100 μm.
Figure 3
Figure 3. Cell proliferation assay with EdU
(A) B13 cells were given EdU for 4 h. Then they were fixed and stained for EdU (red) and DAPI (blue). (B) B13 cells were given EduU for 4 h. Then the cells were transduced with Ad-PNM. At 3 days later, cells were fixed and stained for EdU (red), insulin (green) and DAPI (blue). (C). B13 cells were transduced with Ad-PNM. At 3 days later these cells were given EdU overnight. Next day they were fixed and stained for EdU (red), insulin (green) and DAPI (blue). Scale bars=100 μm. The red colour is slightly enhanced in (B and C) to be consistent with (A). (D) Left-hand bar: percentage of proliferating cells out of total population. Middle and right-hand bars: percentage of proliferating insulin-positive cells out of total insulin-positive cells. Data are means±S.E.M. (n=3).
Figure 4
Figure 4. Total insulin and secreted insulin amount by ELISA
(A) The total insulin amount in the B13 cells with and without Ad-PNM was measured by ELISA. (B) The amount of insulin in the medium released from B13 cells with and without Ad–PNM transduction was measured by ELISA. Cells were stimulated either with low-glucose (open bars) or high-glucose (closed bars) and KCl. Experiments with Ad-PNM-treated cells were performed 3 days after transduction. Data are means±S.E.M. (n=3).
Figure 5
Figure 5. Changes of the histone tail modifications at the promoter regions of the Pdx1, Ins1 and Ins2 genes
ChIP assays were carried out to compare the proportion of the histone tail modifications (H3K4Me3, H3K9Me2, H3K27Me3 and H3Ac) at the promoters of the Gapdh (A), Pdx1 (B), Ins1 (C) and Ins2 (D) genes. The cell types analysed are RIN-m5F cells (stippled bars), B13 cells without Ad-PNM (open bars), B13 cells with Ad-PNM (closed bars) and IRPT cells (diagonal hatched bars). The y-axis shows fold change of samples over negative control rat IgG. Data are means±S.E.M. (n=3).
Figure 6
Figure 6. Changes of the DNA methylation pattern of the Pdx1, Ins1 and Ins2 genes after transduction with Ad-PNM
Comparison of the CpG methylation pattern of the Ins1 (A), Ins2 (B) and Pdx1 (C) genes in RIN-m5F cells, B13 cells with and without Ad-PNM, and IRPT cells. Each circle, divided into ten wedges, represents ten different clones for the same CpG. Open wedges represent unmethylated CpGs and closed wedges represent methylated CpGs. Intact open circles represent CpGs that were not covered by the bisulfite sequencing. UTR, untranslated region.
Figure 7
Figure 7. Amelioration of diabetes by Ad-PNM-transduced B13 cells
(A) Mice were given STZ to induce diabetes at day 0. Cells were transplanted under the kidney capsule at day 7 (grey arrow). Blood glucose levels were then measured every 2 days. At day 17 the transplanted kidneys were removed and analysed for the presence of graft cells (black arrow). Δ, Ad-GFP-treated cells (control); ■, Ad-PNM-treated cells, n=3 and one mouse died after kidney removal; ●, Ad-PNM-treated but without successful engraftment, n=3. Results are means±S.E.M. (B) Explanted kidneys were stained for insulin (red), E-cadherin (green) and DAPI (blue). Scale bar=100 μm.
Figure 8
Figure 8. Transduction of the exocrine pancreas in vivo
(A) Injection of pancreas with Ad-GFP, visualized by GFP fluorescence, showing a high level of transduction in exocrine tissue. (B) Transduction with Ad-PNM, immunostained for Ngn3 (green) and insulin (red). Scale bars=100 μm.

References

    1. Slack J. M. W. Essential Developmental Biology. Oxford: Blackwell Science; 2005.
    1. Zhou Q., Melton D. A. Extreme makeover: converting one cell into another. Cell Stem Cell. 2008;3:382–388. - PubMed
    1. Weintraub H., Tapscott S. J., Davis R. L., Thayer M. J., Adam M. A., Lassar A. B., Miller A. D. Activation of muscle-specific genes in pigment, nerve, fat, liver, and fibroblast cell-lines by forced expression of Myod. Proc. Natl. Acad. Sci. U.S.A. 1989;86:5434–5438. - PMC - PubMed
    1. Shen C. N., Slack J. M. W., Tosh D. Molecular basis of transdifferentiation of pancreas to liver. Nat. Cell Biol. 2000;2:879–887. - PubMed
    1. Xie H., Ye M., Feng R., Graf T. Stepwise reprogramming of B cells into macrophages. Cell. 2004;117:663–676. - PubMed

Publication types

MeSH terms