

Detecting genomic regions associated with a disease using variability functions and Adjusted Rand Index
- PMID: 22151279
- PMCID: PMC3271671
- DOI: 10.1186/1471-2105-12-S9-S9
Detecting genomic regions associated with a disease using variability functions and Adjusted Rand Index
Abstract
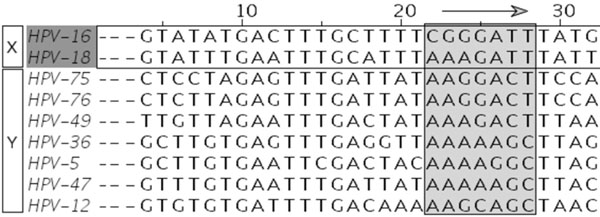
Background: The identification of functional regions contained in a given multiple sequence alignment constitutes one of the major challenges of comparative genomics. Several studies have focused on the identification of conserved regions and motifs. However, most of existing methods ignore the relationship between the functional genomic regions and the external evidence associated with the considered group of species (e.g., carcinogenicity of Human Papilloma Virus). In the past, we have proposed a method that takes into account the prior knowledge on an external evidence (e.g., carcinogenicity or invasivity of the considered organisms) and identifies genomic regions related to a specific disease.
Results and conclusion: We present a new algorithm for detecting genomic regions that may be associated with a disease. Two new variability functions and a bipartition optimization procedure are described. We validate and weigh our results using the Adjusted Rand Index (ARI), and thus assess to what extent the selected regions are related to carcinogenicity, invasivity, or any other species classification, given as input. The predictive power of different hit region detection functions was assessed on synthetic and real data. Our simulation results suggest that there is no a single function that provides the best results in all practical situations (e.g., monophyletic or polyphyletic evolution, and positive or negative selection), and that at least three different functions might be useful. The proposed hit region identification functions that do not benefit from the prior knowledge (i.e., carcinogenicity or invasivity of the involved organisms) can provide equivalent results than the existing functions that take advantage of such a prior knowledge. Using the new algorithm, we examined the Neisseria meningitidis FrpB gene product for invasivity and immunologic activity, and human papilloma virus (HPV) E6 oncoprotein for carcinogenicity, and confirmed some well-known molecular features, including surface exposed loops for N. meningitidis and PDZ domain for HPV.
Figures
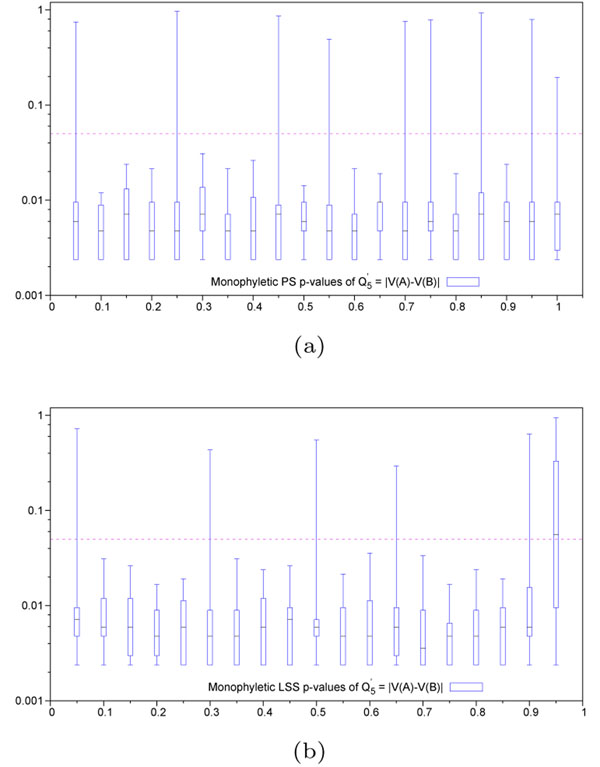
 . Abscissa represents scaling factor of the conserved context in which the variable hit region resides. Values close to 0 represent conservation (maximum discrimination), while values close to 1 represent variability (identical to context). Variable hit region is always maintained at a scaling factor of 1. Ordinate represents p-values in log-scale. Horizontal dashed line represents the significance threshold of 0.05. (b) Lineage specific selection - Heterogeneous hit region inside neutral context. Quartile distribution of p-values obtained for the function
  . Abscissa represents the difference in scaling factors among the two lineages present in the hit region. Values close to 0 represent homogeneous evolutionnary speed (similar to the neutral context in which it resides), while values close to 1 represent divergence among these lineages. Context is always maintained at a scaling factor of 0.5, simulating neutral evolution. Horizontal dashed line represents the significance threshold of 0.05. In the case of lineage specific selection, the value of the Q′-tγpe functions corresponding to 1 on the abscissa scale cannot be computed because it involves a sub-tree with 0 edge lengths.
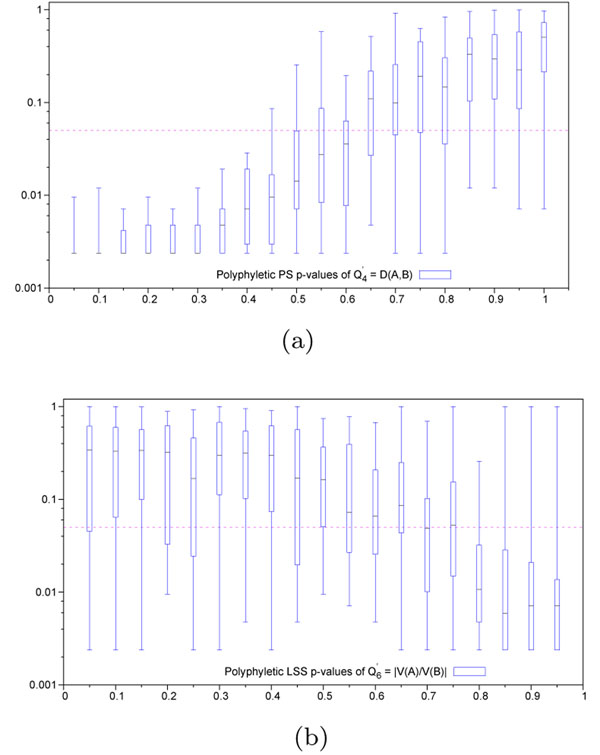
 . Variable hit region is always maintained at a scaling factor of 1. Abscissa represents scaling factor of the conserved context in which the variable hit region resides. Values close to 0 represent conservation (maximum discrimination), while values close to 1 represent variability (identical to context). Ordinate represents p-values in log-scale. Horizontal dashed line represents the significance threshold of 0.05. (b) Lineage specific selection - Heterogeneous hit region inside neutral context. Quartile distribution of p-values obtained for the function
  . Context is always maintained at a scaling factor of 0.5, simulating neutral evolution. Abscissa represents difference in scaling factors among the two lineages present in the hit region. Values close to 0 represent homogeneous evolutionnary speed (similar to the neutral context in which it resides), while values close to 1 represent divergence among these lineages, and from the neutral context. Horizontal dashed line represents significance threshold of 0.05.
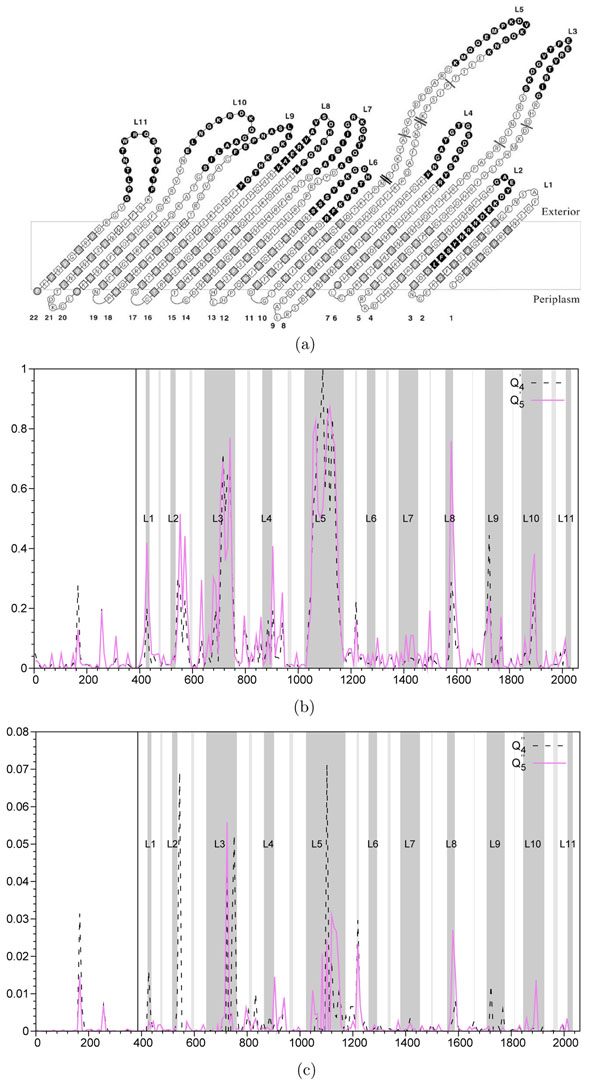
 and
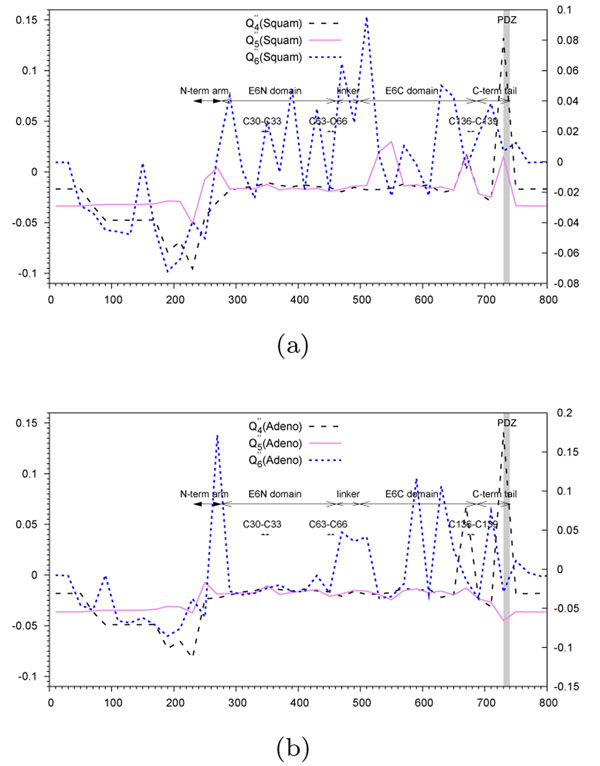
and  are depicted by a dashed line and functions
  and
and  are depicted by a continuous line. A non-overlapping sliding window of size 9 nucleotides was used during the scan of the gene FrpB MSA. The abscissa axis represents the window position along the nucleotide MSA. 11 gray zones correspond to extracellular loops. Annotations start at the solid vertical line (near the 400 abscissa mark).
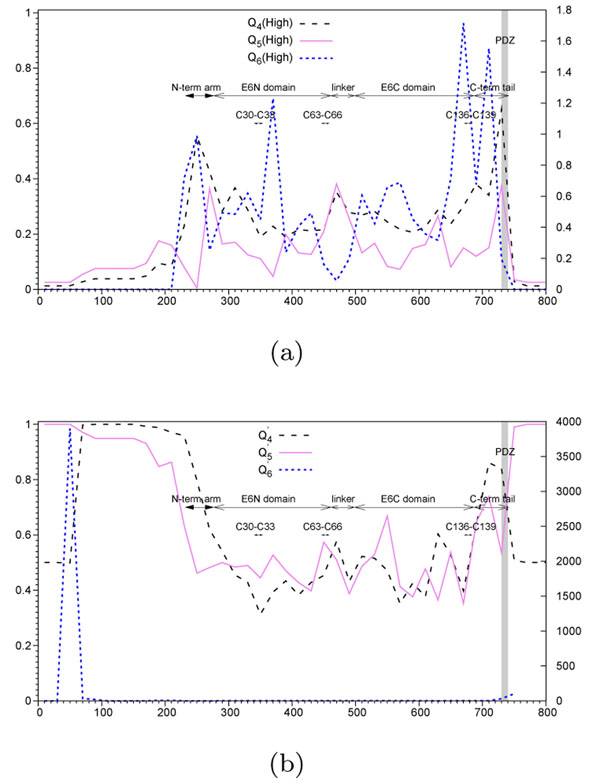
Similar articles
-
A whole genome study and identification of specific carcinogenic regions of the human papilloma viruses.J Comput Biol. 2009 Oct;16(10):1461-73. doi: 10.1089/cmb.2009.0091. J Comput Biol. 2009. PMID: 19754274
-
Analysis of Neisseria meningitidis class 3 outer membrane protein gene variable regions and type identification using genetic techniques.Infect Immun. 1995 Apr;63(4):1484-90. doi: 10.1128/iai.63.4.1484-1490.1995. Infect Immun. 1995. PMID: 7890414 Free PMC article.
-
DNA Methylation Assessed by SMRT Sequencing Is Linked to Mutations in Neisseria meningitidis Isolates.PLoS One. 2015 Dec 11;10(12):e0144612. doi: 10.1371/journal.pone.0144612. eCollection 2015. PLoS One. 2015. PMID: 26656597 Free PMC article.
-
Genome flexibility in Neisseria meningitidis.Vaccine. 2009 Jun 24;27 Suppl 2(Suppl 2):B103-11. doi: 10.1016/j.vaccine.2009.04.064. Epub 2009 May 27. Vaccine. 2009. PMID: 19477564 Free PMC article. Review.
-
Omp85, an evolutionarily conserved bacterial protein involved in outer-membrane-protein assembly.Res Microbiol. 2004 Apr;155(3):129-35. doi: 10.1016/j.resmic.2003.11.007. Res Microbiol. 2004. PMID: 15143770 Review.
Cited by
-
A Generalized Bayesian Stochastic Block Model for Microbiome Community Detection.Stat Med. 2025 Feb 10;44(3-4):e10291. doi: 10.1002/sim.10291. Stat Med. 2025. PMID: 39853798 Free PMC article.
References
-
- Kimura M. The neutral theory of molecular evolution. Cambridge Univ Pr; 1985.
-
- Moran P. The statistical processes of evolutionary theory. The statistical processes of evolutionary theory. 1962.
-
- Siepel A, Bejerano G, Pedersen JS, Hinrichs AS, Hou M, Rosenbloom K, Clawson H, Spieth J, Hillier LW, Richards S, Weinstock GM, Wilson RK, Gibbs Ra, Kent WJ, Miller W, Haussler D. Evolutionary conserved elements in vertebrate, insect, worm, and yeast genomes. Genome research. 2005;15(8):1034–50. doi: 10.1101/gr.3715005. http://www.ncbi.nlm.nih.gov/pubmed/16024819 - DOI - PMC - PubMed
Publication types
MeSH terms
Substances
LinkOut - more resources
Full Text Sources
Miscellaneous
