. 2012 Jan;35(1):85-96.
doi: 10.1111/j.1460-9568.2011.07936.x. Epub 2011 Dec 13.

Projections and interconnections of genetically defined serotonin neurons in mice

Affiliations

Projections and interconnections of genetically defined serotonin neurons in mice

Sun Jung Bang et al. Eur J Neurosci. 2012 Jan.

Abstract

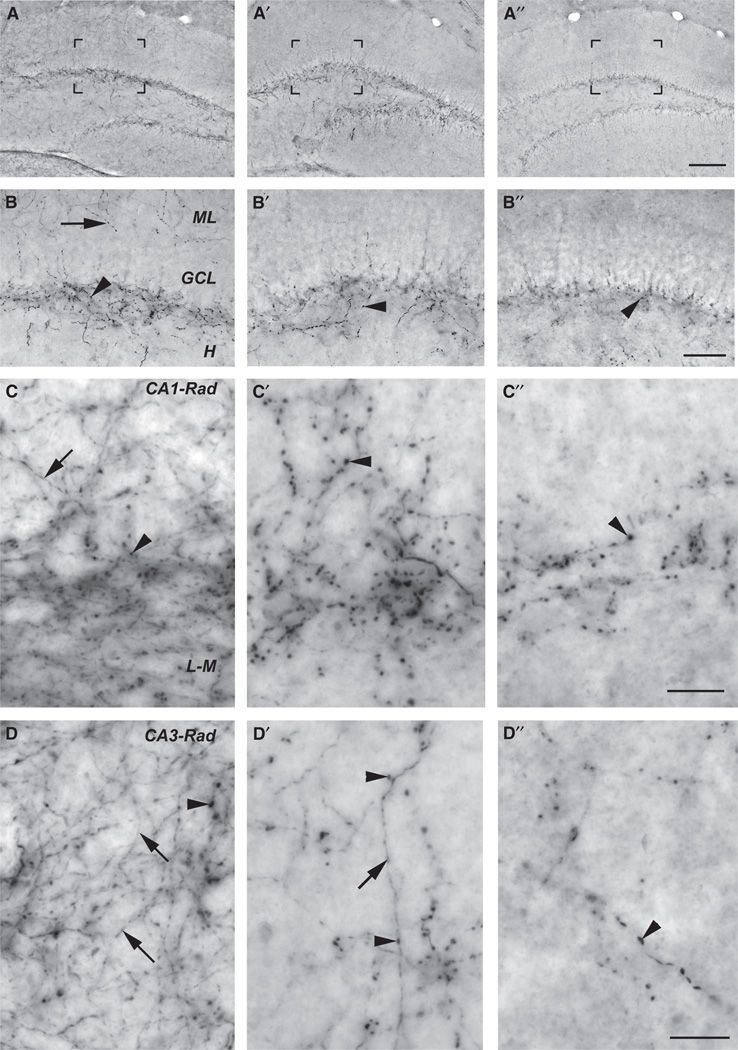
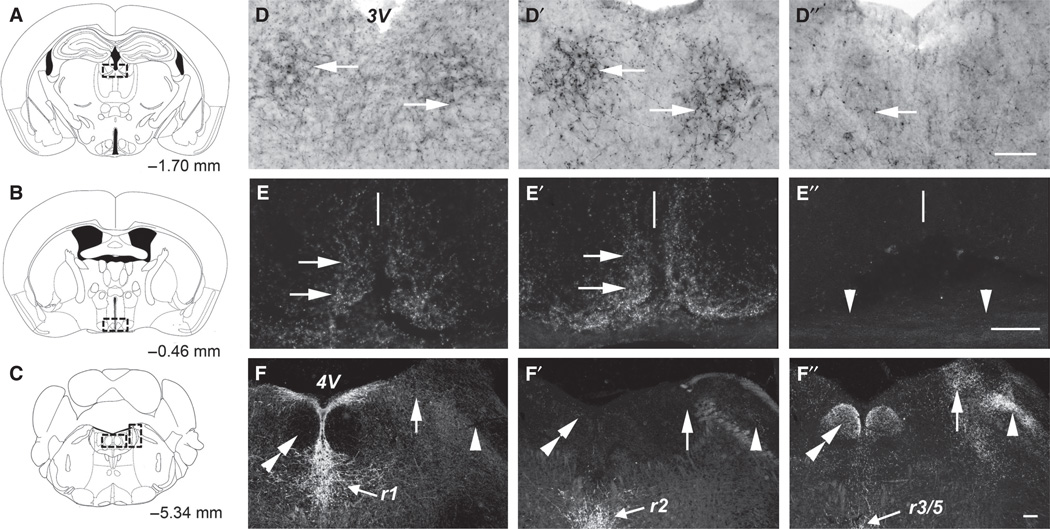
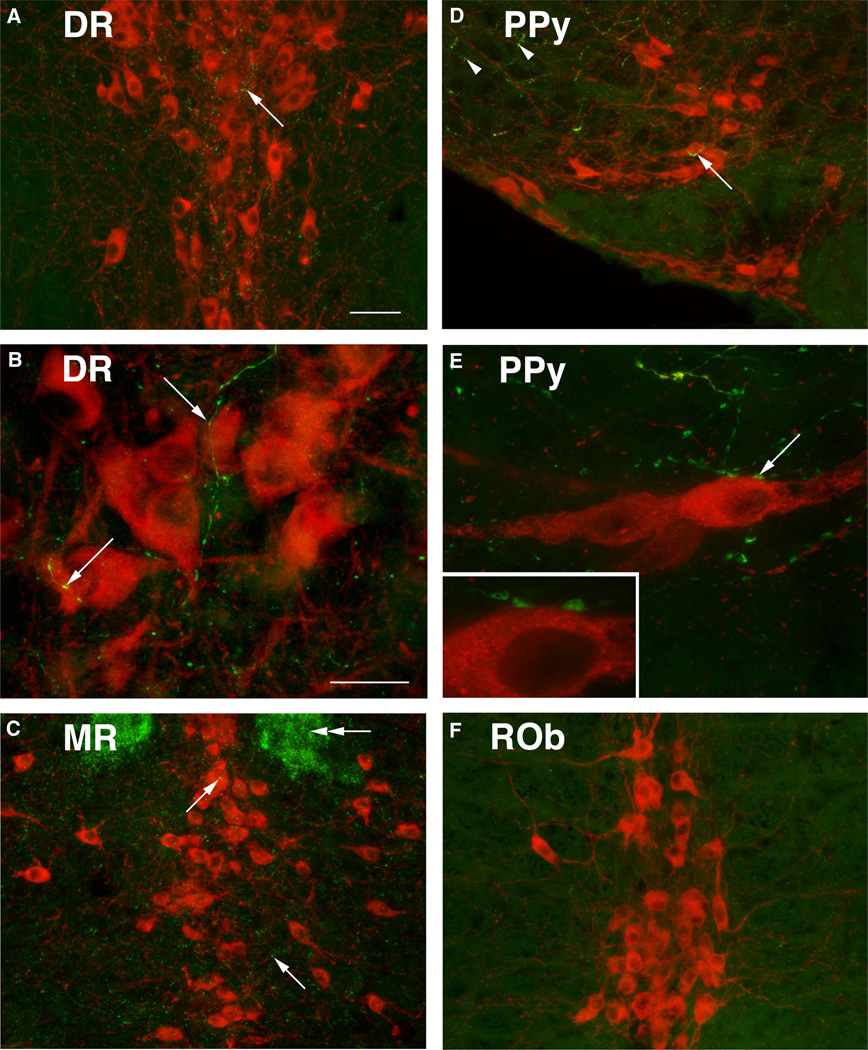
Brain serotonin neurons are heterogeneous and can be distinguished by several anatomical and physiological characteristics. Toward resolving this heterogeneity into classes of functional relevance, subtypes of mature serotonin neurons were previously identified based on gene expression differences initiated during development in different rhombomeric (r) segments of the hindbrain. This redefinition of mature serotonin neuron subtypes based on the criteria of genetic lineage, along with the enabling genetic fate mapping tools, now allows various functional properties, such as axonal projections, to be allocated onto these identified subtypes. Furthermore, our approach uniquely enables interconnections between the different serotonin neuron subtypes to be determined; this is especially relevant because serotonin neuron activity is regulated by several feedback mechanisms. We used intersectional and subtractive genetic fate mapping tools to generate three independent lines of mice in which serotonin neurons arising in different rhombomeric segments, either r1, r2 or both r3 and r5, were uniquely distinguished from all other serotonin neurons by their expression of enhanced green fluorescent protein. Each of these subgroups of serotonergic neurons had a unique combination of forebrain projection targets. Typically more than one subgroup innervated an individual target area. Unique patterns of interconnections between the different groups of serotonin neurons were also observed and these pathways could subserve feedback regulatory circuits. Overall, the current findings suggest that activation of subsets of serotonin neurons could result in topographic serotonin release in the forebrain coupled with feedback inhibition of serotonin neurons with alternative projection targets.


Figures

Fig. 1
Fig. 1
The distribution of serotonin neurons with developmental origin in rhombomere (r) 1, 2 or either 3 or 5 identified by eGFP expression was consistent with prior fate mapping (Jensen et al., 2008). (A–C) Darkfield illumination of immunoperoxidase labeling for eGFP at similar levels through the pons of each of the three mouse lines studied. In each panel, the medial longitudinal fasiculus (mlf) is visible. (A) r1-Pet1 neurons are visible in the dorsal raphe (DR) and dorsal portion of the median raphe (MR). (B) r2-Pet1 neurons constitute a smaller population of neurons visible in the middle third of the MR. (C) r3 / 5-Pet1 neurons are visible in the ventral MR, and their axons in the ventral tegmental nucleus of Gudden (arrowhead). Scale bar = 150 µm.
Fig. 2
Fig. 2
Projection patterns of r1-Pet1 neurons (left column), r2-Pet1 neurons (center column) and r3 / 5-Pet1 neurons (right column) in the prefrontal and parietal cortices. (A–A″) In the prelimbic cortex, parallel lines designate the layer V pyramidal cell layer. (A) r1-Pet1 axons are enriched in lamina I / II (arrow) and found in deeper layers (arrowhead). (A′) r2-Pet1 axons are found through layers III–VI (arrowheads). (A″) Only an occasional, individual axon (arrowhead) arising from r3 / 5-Pet1 neurons was found in the prelimbic cortex. (B–B″) High-magnification images show that r1-Pet1 neurons (B) have typically fine axons (arrow) and those with minute beads (arrowhead) while r2- Pet1 (B′) and r3 / 5- Pet1 (B″) neurons have axons with more pronounced, larger beads (arrowheads). (C–C″) Innervation of parietal cortex by r1- (C), r2- (C′) and r3 / 5- (C″) Pet1 neurons. (C) r1-Pet1 neurons were found in superficial and deeper layers, but without obvious laminar distributions. (C′) r2-Pet1 neurons also innervated the parietal cortex (arrowheads). (C″) Axons from r3 / 5-Pet1 cells were not detected in parietal cortex. (D) Higher magnification of r1-Pet1 axons in lamina 1 of prefrontal cortex shows small beaded morphology (arrow), although occasional varicosities are larger (arrowhead). (D′) Higher magnification of r2-Pet1 axons in parietal cortex shows large varicosites (arrowheads). (D″) Higher magnification of r3 / 5-Pet1 axon located in prefrontal cortex shows a single ramification with large beaded morphology (arrowhead). Scale bar in A = 100 µm; B = 50 µm; C = 150 µm; D = 50 µm.
Fig. 3
Fig. 3
Hippocampal projections from r1-Pet1 neurons (left column), r2-Pet1 neurons (center column) and r3 / 5-Pet1 neurons (right column). (A–A″) Innervation of the dentate gyrus; boxed areas shown at higher magnification in B through B″. (B) Beaded axons pertaining to r1-Pet1 neurons (arrowhead) are visible below the granule cell layer (GCL) extending into the hilus (H). In addition, axons with smaller varicosities (arrow) are visible in the molecular layer (ML). Beaded r2-Pet1 axons (B′) and r3 / 5-Pet1 axons (B″) are most prominent subjacent to the granule cell layer (arrowheads). (C–C″) Innervation of the border between strata lacunosum-moleculare (L–M) and radiatum (Rad) of area CA1. Each group of cells provides axons with large varicosities to this area (arrowheads in each panel). r1-Pet1 cells, however, also provide finer axons (arrow in C), particularly extending into stratum radiatum. In stratum radiatum of CA3, (D) r1-Pet1 axons are both smooth with modest periodic enlargements or ‘small varicosities’, but a few very large boutons are also seen (arrowhead). (D′) A segment of thin axon (arrow) associated with larger boutons that are spaced farther apart (arrowheads) pertaining to r2-Pet1 neurons. (D″) r3/ 5-Pet1 axons tend to be sparse but with large varicosities (arrowheads). Scale bar in A = 100 µm; B = 50 µm; C and D = 35 µm.
Fig. 4
Fig. 4
Subcortical projection pattern of r1-Pet1 neurons, r2-Pet1 neurons and r3 / 5-Pet1 neurons. (A–C) Boxed areas within line drawings adapted from Paxinos mouse atlas plates (Paxinos & Franklin, 2001) indicate the location of the photomicrographs in the same row. (D–D″) The periventricular nucleus of the thalamus located bilaterally at the base of the third ventricle (3V). r1-Pet1 (D) and r2-Pet1 (D′) neurons densely innervate this area (arrows) while r3 / 5-Pet1 neurons (D″) send a few scattered axons (arrow). (E–E″) Darkfield images of innervation within the suprachiasmatic nucleus (SCN), where the midline is designated with a vertical line. r1-Pet1 and r2-Pet1 neurons contribute to innervation of the SCN (arrows in E and E′, respectively), whereas r3 / 5-Pet1 axons are undetected above the optic chiasm (arrowheads in E″). (F–F″) In the rostral medulla, at the base of the fourth ventricle (4V), different patterns of innervation can be seen. (F) r1-Pet1 neurons (r1, arrow) send very few axons to the dorsal tegmental nucleus of Gudden (double arrowheads) and sparsely innervate the rostral pole of the locus coeruleus (LC, arrow) and parabrachial nucleus (arrowhead). (F′) r2-Pet1 neurons (r2, arrow) have very sparse innervation of the same areas. (F″) In contrast, r3 / 5-Pet1 neurons richly innervate Gudden’s tegmental nucleus (double arrowheads), the rostral LC (arrow) and the lateral parabrachial nucleus (arrowhead). A few dendrites from r3 / 5-neurons are visible at the bottom of the field (r3 / 5, arrow). Scale bar = 100 µm.
Fig. 5
Fig. 5
Schematic mapping, based on the flat maps of Swanson (2004), showing areas innervated by r1-Pet1 neurons (A), r2-Pet1 neurons (B) or r3 / 5-Pet1 neurons (C). (A) r1-Pet1 neurons have widespread axons including all of the targets of the DR as well as some targets of the MR and B9. Particularly dense innervation (dark blue) was noted in the medial septum (MS), the nucleus of the diagonal band (DB), nucleus accumbens shell region (SH), globus pallidus (GP), ventral pallidum (VP), substantia innominata (SI), basolateral amygdala (BLA), throughout the hypothalamus, ventral tegmental area (VTA), substantia nigra pars compacta (SNc) and pars reticulata (SNr). Areas with relatively less innervation are indicated in light blue. (B) Areas with dense (dark orange) innervation from r2-Pet1 neurons include the nucleus of the diagonal band (DB) and medial septum, suprachiasmatic nucleus (SCN), and periventriuclar nucleus of the thalamus (PV). Areas with less dense innervation from r2-Pet1 neurons (light orange) include prefrontal cortex including prelimbic (PL) and infralimbic (IL) areas, parietal cortex, lateral septum (LS), hippocampus, basolateral amygdala (BLA), hypothalamus and median raphe (MR). (C) r3 / 5-Pet1 neurons shared some targets with r2-Pet1 neurons, but also had distinctive projection sites with either dense (dark pink) or moderate (light pink) density of axons. Dense innervation targets included the medial septum (MS) and nucleus of the diagonal band (DB), ventral, anterior and dorsal tegmental nuclei of Gudden (Tg), parabraichal (PB) and locus coeruleus (LC). Less dense innervation was detected in the median and dorsal raphe nuclei (MR, DR), hypothalamus, lateral septum (LS), piriform (PIR) and amgydalar cortex (COA) as well as the capsular part of the central nucleus of the amygdala (CeC) and hippocampus. For interpretation of color references in figure legend, please refer to the Web version of this article.
Fig. 6
Fig. 6
Projections of r1-Pet1 neurons (green) to other groups of serotonin neurons, identified by immunolabeling for TPH2 (red). (A) r1-Pet1 axons, detected by immunolabeling for eGFP (green), are visible coursing dorsal–ventral (arrows) overlying non-r1-derived serotonin neurons (red) in the caudal and ventral portions of the MR. Scale bar = 20 µm. (B) Higher magnification of another section of the MR reveals thin and varicose r1-Pet1 (green) axons in the vicinity of serotonin cell bodies (arrow). Inset – a single optical section at the area indicated by the arrow. Scale bar = 50 µm. (C) Caudally, r1-Pet1 axons (green) are visible on the midline through raphe mangus (RMg) and raphe obscurus (ROb; D) intermingling with serotonin neurons (arrows). Raphe pallidus (E; RPa) is sparsely innervated by a few r1-Pet1 axons, one indicated with an arrow. (F) An intermediate density of r1-Pet1 axons (green, arrows) is visible in the vicinity of laterally displaced serotonin neurons in the paragigantocellular area (LPGi). For interpretation of color references in figure legend, please refer to the Web version of this article.
Fig. 7
Fig. 7
r1-Pet1 axons have a differing propensity to innervate other serotonin cell groups. Asterisks denote significant differences between groups.
Fig. 8
Fig. 8
Maximal projections of Z-stack images showing axons of r2-Pet1 neurons abundant only in the MR, proximal to the location of r2-Pet1 cell bodies. (A) MR neurons rostral and dorsal to r2-Pet1-derived neurons intermix with axons from r2-Pet1 neurons, detected by immunolabeling for eGFP (green). Scale bar = 25 µm. (B) In another section of the same part of the MR, varicose axons (arrows) are visible in proximity to serotonin neurons (arrows). Scale bar = 10 µm. For interpretation of color references in figure legend, please refer to the Web version of this article.
Fig. 9
Fig. 9
Comparison of projections to the DR by r2-Pet1 (A, A′)- and r3 / 5-Pet1 (B, B′)- neurons. (A) Using darkfield illumination, r2-Pet1 neurons are visible in the MR (arrows) ventral to the DR (bracketed region) at the base of the aqueduct (Aq) (scale bar = 200 µm). Higher magnification (scale bar = 100 µm) of bracketed area in A′ reveals a single fiber (arrow). (B) In a similar section through the DR, r3 / 5-pet1 cell bodies lie ventrally (arrow). Very dense innervation is seen in the anterior tegmental nucleus (or ventral tegmental nucleus of Gudden; arrowhead), while a plexus of fibers overlies the DR. Bracketed region shown at higher magnification in B′ shows many varicose fibers in the DR.
Fig. 10
Fig. 10
Projections of r3 / 5-Pet1 neurons to other serotonin neuron groups. (A) In the DR, axons of r3 / 5-Pet1 neurons (arrow) intermingle with serotonin neurons. Scale bar = 50 µm. (B) Another section of the DR at higher magnification (scale bar = 20 µm) shows varicose r3 / 5-Pet1-GFP labeled axons (arrow). (C) In the MR, ventral to the anterior tegmental nucleus of Gudden (double-headed arrow), r3 / 5-Pet1 axon varicosities (arrows) are in the same area as serotonin neurons. (D) Axons from r3 / 5-Pet1 neurons are visible tracking lateral to serotonin neurons in the medulla (arrowheads), and at a lower density, nearer to serotonin neurons (arrow). (E) Serotonin neurons in the paragigantocellular area with adjacent r3 / 5-Pet1 boutons (arrow). Inset – both axon and cell body within a single optical plane. (F) Very few axons from r3 / 5-Pet1 neurons are detectable in raphe obscurus and pallidus.

Comment in

References

    1. Awatramani R, Soriano P, Rodriguez C, Mai JJ, Dymecki SM. Cryptic boundaries in roof plate and choroid plexus identified by intersectional gene activation. Nat. Genet. 2003;35:70–75. - PubMed
    1. Barnes NM, Sharp T. A review of central 5-HT receptors and their function. Neuropharmacology. 1999;38:1083–1152. - PubMed
    1. Beitz AJ. The sites of origin brain stem neurotensin and serotonin projections to the rodent nucleus raphe magnus. J. Neurosci. 1982;2:829–842. - PMC - PubMed
    1. Bland ST, Hargrave D, Pepin JL, Amat J, Watkins LR, Maier SF. Stressor controllability modulates stress-induced dopamine and serotonin efflux and morphine-induced serotonin efflux in the medial prefrontal cortex. Neuropsychopharmacology. 2003;28:1589–1596. - PubMed
    1. Commons KG. Evidence for topographically organized endogenous 5-HT-1A receptor-dependent feedback inhibition of the ascending serotonin system. Eur. J. Neurosci. 2008;27:2611–2618. - PMC - PubMed

Publication types

MeSH terms

Substances