

Introgression of mitochondrial DNA among Myodes voles: consequences for energetics?
- PMID: 22151479
- PMCID: PMC3260118
- DOI: 10.1186/1471-2148-11-355
Introgression of mitochondrial DNA among Myodes voles: consequences for energetics?
Abstract
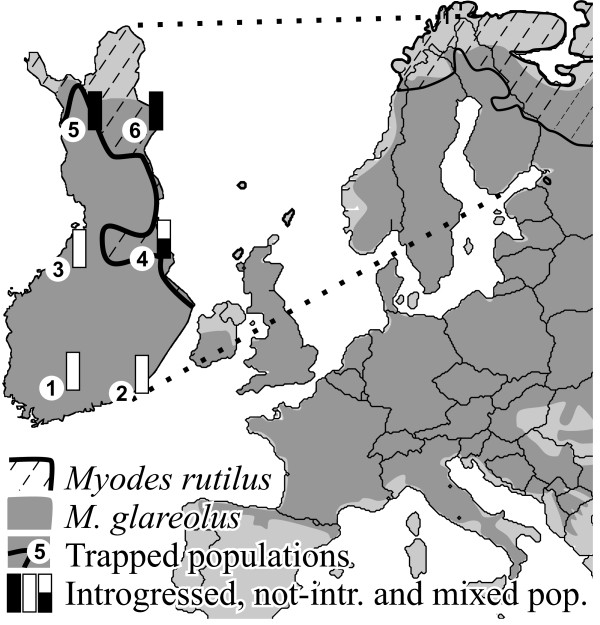
Background: Introgression of mitochondrial DNA (mtDNA) is among the most frequently described cases of reticulate evolution. The tendency of mtDNA to cross interspecific barriers is somewhat counter-intuitive considering the key function of enzymes that it encodes in the oxidative-phosphorylation process, which could give rise to hybrid dysfunction. How mtDNA reticulation affects the evolution of metabolic functions is, however, uncertain. Here we investigated how morpho-physiological traits vary in natural populations of a common rodent (the bank vole, Myodes glareolus) and whether this variation could be associated with mtDNA introgression. First, we confirmed that M. glareolus harbour mtDNA introgressed from M. rutilus by analyzing mtDNA (cytochrome b, 954 bp) and nuclear DNA (four markers; 2333 bp in total) sequence variation and reconstructing loci phylogenies among six natural populations in Finland. We then studied geographic variation in body size and basal metabolic rate (BMR) among the populations of M. glareolus and tested its relationship with mtDNA type.
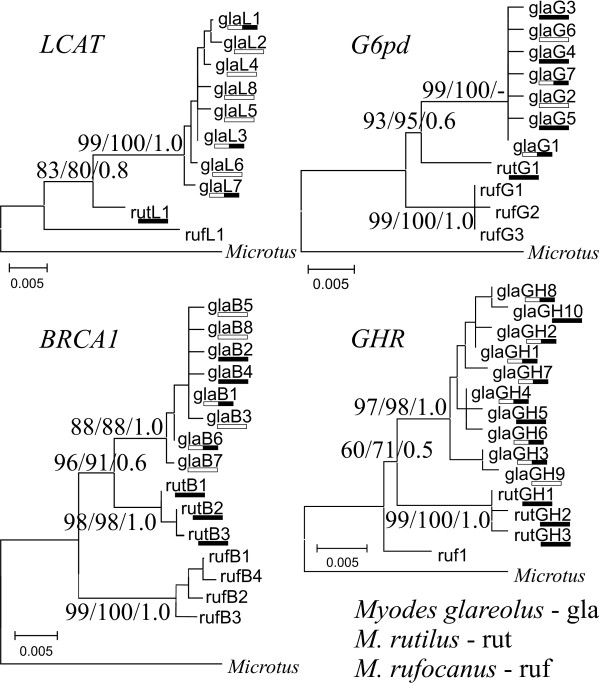
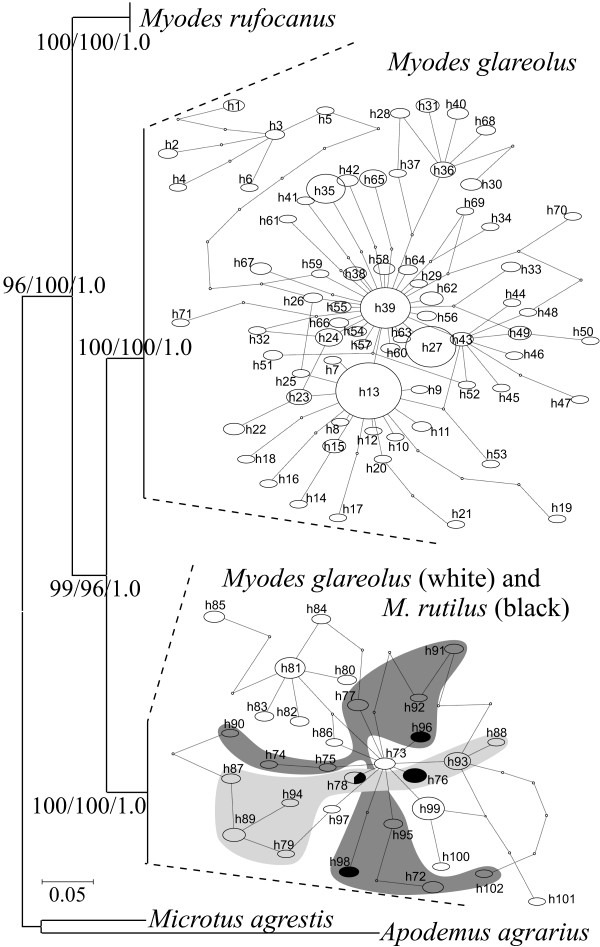
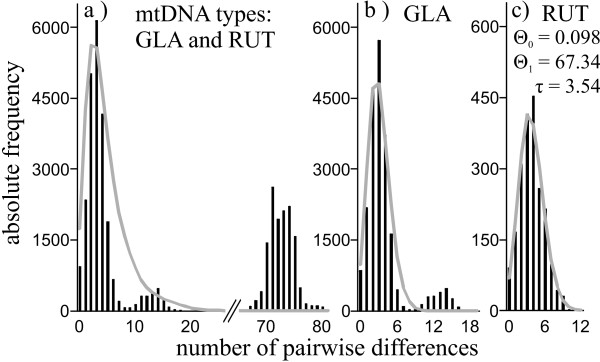
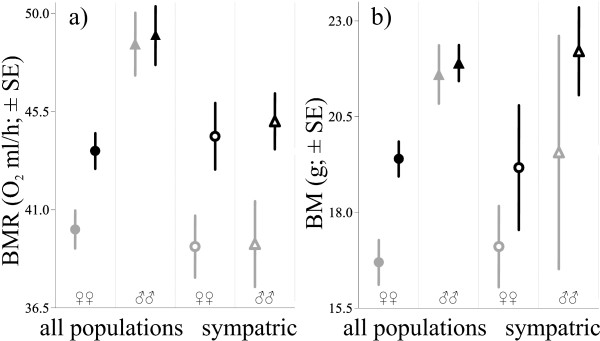
Results: Myodes glareolus and its arctic neighbour, M. rutilus, are reciprocally monophyletic at the analyzed nuclear DNA loci. In contrast, the two northernmost populations of M. glareolus have a fixed mitotype that is shared with M. rutilus, likely due to introgressive hybridization. The analyses of phenotypic traits revealed that the body mass and whole-body, but not mass corrected, BMR are significantly reduced in M. glareolus females from northern Finland that also have the introgressed mitotype. Restricting the analysis to the single population where the mitotypes coexist, the association of mtDNA type with whole-body BMR remained but those with mass corrected BMR and body mass did not. Mitochondrial sequence variation in the introgressed haplotypes is compatible with demographic growth of the populations, but may also be a result of positive selection.
Conclusion: Our results show that the phenotypic traits vary markedly along the north-south axis of populations of M. glareolus. This variation may be related to adaptation to local environments and coincides with the gradient of genome reticulation between M. glareolus and M. rutilus, which was assessed by mtDNA introgression. Introgression of mtDNA may have affected morpho-physiological traits but do not show strong effects on either body mass or basal metabolic rate alone. We discuss the causes and biological meaning of our results and the means to clarify these questions in future research.
Figures
Similar articles
-
Molecular and ecological signs of mitochondrial adaptation: consequences for introgression?Heredity (Edinb). 2014 Oct;113(4):277-86. doi: 10.1038/hdy.2014.28. Epub 2014 Apr 2. Heredity (Edinb). 2014. PMID: 24690754 Free PMC article.
-
[Genetic variation and phylogeography of the bank vole (Clethrionomys glareolus, Arvicolinae, Rodentia) in Russia with special reference to the introgression of the mtDNA of a closely related species, red-backed vole (C. rutilus)].Genetika. 2009 May;45(5):610-23. Genetika. 2009. PMID: 19534420 Russian.
-
Historic hybridization and persistence of a novel mito-nuclear combination in red-backed voles (genus Myodes).BMC Evol Biol. 2009 May 21;9:114. doi: 10.1186/1471-2148-9-114. BMC Evol Biol. 2009. PMID: 19460158 Free PMC article.
-
The biogeography of mitochondrial and nuclear discordance in animals.Mol Ecol. 2012 Aug;21(16):3907-30. doi: 10.1111/j.1365-294X.2012.05664.x. Epub 2012 Jun 27. Mol Ecol. 2012. PMID: 22738314 Review.
-
The on-again, off-again relationship between mitochondrial genomes and species boundaries.Mol Ecol. 2017 Apr;26(8):2212-2236. doi: 10.1111/mec.13959. Epub 2017 Jan 27. Mol Ecol. 2017. PMID: 27997046 Free PMC article. Review.
Cited by
-
Mito-nuclear discordance across a recent contact zone for California voles.Ecol Evol. 2018 May 24;8(12):6226-6241. doi: 10.1002/ece3.4129. eCollection 2018 Jun. Ecol Evol. 2018. PMID: 29988439 Free PMC article.
-
Ubiquity and diversity of human-associated Demodex mites.PLoS One. 2014 Aug 27;9(8):e106265. doi: 10.1371/journal.pone.0106265. eCollection 2014. PLoS One. 2014. PMID: 25162399 Free PMC article.
-
Phylogeography of Puumala orthohantavirus in Europe.Viruses. 2019 Jul 24;11(8):679. doi: 10.3390/v11080679. Viruses. 2019. PMID: 31344894 Free PMC article.
-
The effects of allospecific mitochondrial genome on the fitness of northern redbelly dace (Chrosomus eos).Ecol Evol. 2018 Feb 19;8(6):3311-3321. doi: 10.1002/ece3.3922. eCollection 2018 Mar. Ecol Evol. 2018. PMID: 29607026 Free PMC article.
-
Punctuated invasion of water, ice, snow and terrestrial ecozones by segmented worms (Oligochaeta: Enchytraeidae: Mesenchytraeus).Proc Biol Sci. 2017 Oct 11;284(1864):20171081. doi: 10.1098/rspb.2017.1081. Proc Biol Sci. 2017. PMID: 29021169 Free PMC article.
References
-
- Boratyński Z, Koteja P. Sexual and natural selection on body mass and metabolic rates in free-living bank voles. Funct Ecol. 2010;24(6):1252–1261. doi: 10.1111/j.1365-2435.2010.01764.x. - DOI
-
- Boratyński Z, Koteja P. The association between body mass, metabolic rates and survival of bank voles. Funct Ecol. 2009;23(2):330–339. doi: 10.1111/j.1365-2435.2008.01505.x. - DOI
-
- Jackson DM, Trayhurn P, Speakman JR. Associations between energetics and over-winter survival in the short-tailed field vole Microtus agrestis. J Anim Ecol. 2001;70(4):633–640. doi: 10.1046/j.1365-2656.2001.00518.x. - DOI
-
- Sadowska ET, Labocha MK, Baliga K, Stanisz A, Wroblewska AK, Jagusiak W, Koteja P. Genetic correlations between basal and maximum metabolic rates in a wild rodent: consequences for evolution of endothermy. Evolution. 2005;59(3):672–681. - PubMed
Publication types
MeSH terms
Substances
LinkOut - more resources
Full Text Sources
