

Studying relationships between environment and malaria incidence in Camopi (French Guiana) through the objective selection of buffer-based landscape characterisations
- PMID: 22151738
- PMCID: PMC3286409
- DOI: 10.1186/1476-072X-10-65
Studying relationships between environment and malaria incidence in Camopi (French Guiana) through the objective selection of buffer-based landscape characterisations
Abstract
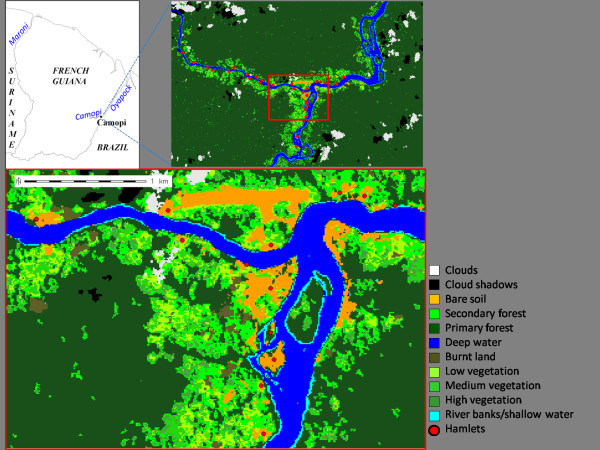
Background: Malaria remains a major health problem in French Guiana, with a mean of 3800 cases each year. A previous study in Camopi, an Amerindian village on the Oyapock River, highlighted the major contribution of environmental features to the incidence of malaria attacks. We propose a method for the objective selection of the best multivariate peridomestic landscape characterisation that maximises the chances of identifying relationships between environmental features and malaria incidence, statistically significant and meaningful from an epidemiological point of view.
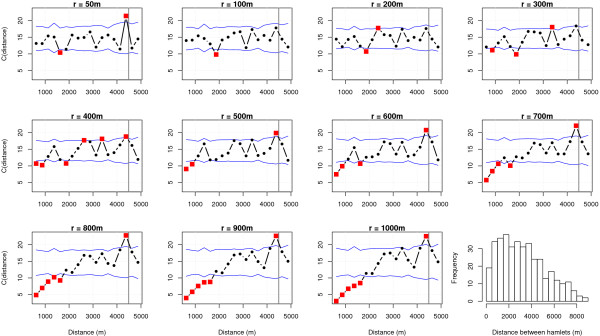
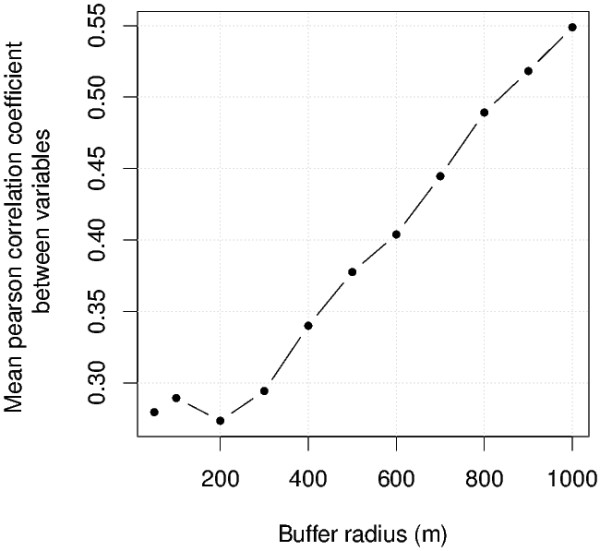
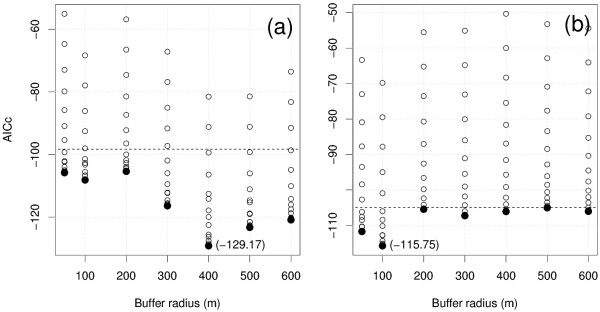
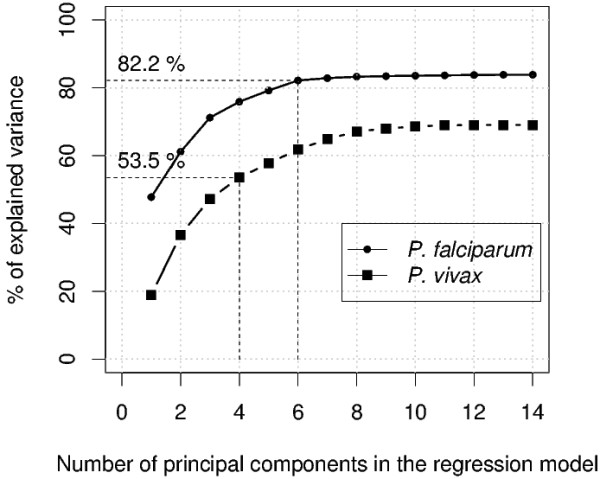
Methods: A land-cover map, the hydrological network and the geolocalised inhabited houses were used to characterise the peridomestic landscape in eleven discoid buffers with radii of 50, 100, 200, 300, 400, 500, 600, 700, 800, 900 and 1000 metres. Buffer-based landscape characterisations were first compared in terms of their capacity to discriminate between sites within the geographic space and of their effective multidimensionality in variable space. The Akaike information criterion (AIC) was then used to select the landscape model best explaining the incidences of P. vivax and P. falciparum malaria. Finally, we calculated Pearson correlation coefficients for the relationships between environmental variables and malaria incidence, by species, for the more relevant buffers.
Results: The optimal buffers for environmental characterisation had radii of 100 m around houses for P. vivax and 400 m around houses for P. falciparum. The incidence of P. falciparum malaria seemed to be more strongly linked to environmental features than that of P. vivax malaria, within these buffers. The incidence of P. falciparum malaria in children was strongly correlated with proportions of bare soil (r = -0.69), land under high vegetation (r = 0.68) and primary forest (r = 0.54), landscape division (r = 0.48) and the number of inhabited houses (r = -0.60). The incidence of P. vivax malaria was associated only with landscape division (r = 0.49).
Conclusions: The proposed methodology provides a simple and general framework for objective characterisation of the landscape to account for field observations. The use of this method enabled us to identify different optimal observation horizons around houses, depending on the Plasmodium species considered, and to demonstrate significant correlations between environmental features and the incidence of malaria.
© 2011 Stefani et al; licensee BioMed Central Ltd.
Figures
References
-
- Carme B, Ardillon V, Girod R, Grenier C, Joubert M, Djossou F, Ravachol F. [Update on the epidemiology of malaria in French Guiana] (in French) Med Trop. 2009;69:19–25. - PubMed
-
- Hustache S, Nacher M, Djossou F, Carme B. Malaria risk factors in Amerindian children in French Guiana. Am J Trop Med Hyg. 2007;76:619–625. - PubMed
-
- Floch H. La lutte antipaludique en Guyane française. L'anophélisme. Riv Malariol. 1955;24:57–65. - PubMed
-
- Mouchet J, Nadire-Galliot M, Poman JP, Claustre J, Bellony S. Le paludisme en Guyane. Les caractéristiques des différents foyers et la lutte antipaludique. Bull Soc Pathol Exot. 1989;82:393–405. - PubMed
-
- Pajot F-X, Le Pont F, Molez J-F, Degallier N. Agressivité d'Anopheles (Nyssorhuynchus) darlingi Root, 1926 (Diptera, Culicidae) en Guyane française. Cah ORSTOM, sér Ent méd et Parasitol. 1977;15:15–22.
Publication types
MeSH terms
LinkOut - more resources
Full Text Sources
