. 2011 Dec 7:10:104.
doi: 10.1186/1475-2859-10-104.

The impact of phosphate scarcity on pharmaceutical protein production in S. cerevisiae: linking transcriptomic insights to phenotypic responses

Affiliations

The impact of phosphate scarcity on pharmaceutical protein production in S. cerevisiae: linking transcriptomic insights to phenotypic responses

Ali Kazemi Seresht et al. Microb Cell Fact. .

Abstract

Background: The adaptation of unicellular organisms like Saccharomyces cerevisiae to alternating nutrient availability is of great fundamental and applied interest, as understanding how eukaryotic cells respond to variations in their nutrient supply has implications spanning from physiological insights to biotechnological applications.

Results: The impact of a step-wise restricted supply of phosphate on the physiological state of S. cerevisiae cells producing human Insulin was studied. The focus was to determine the changes within the global gene expression of cells being cultured to an industrially relevant high cell density of 33 g/l cell dry weight and under six distinct phosphate concentrations, ranging from 33 mM (unlimited) to 2.6 mM (limited). An increased flux through the secretory pathway, being induced by the PHO circuit during low P(i) supplementation, proved to enhance the secretory production of the heterologous protein. The re-distribution of the carbon flux from biomass formation towards increased glycerol production under low phosphate led to increased transcript levels of the insulin gene, which was under the regulation of the TPI1 promoter.

Conclusions: Our study underlines the dynamic character of adaptive responses of cells towards a change in their nutrient access. The gradual decrease of the phosphate supply resulted in a step-wise modulated phenotypic response, thereby alternating the specific productivity and the secretory flux. Our work emphasizes the importance of reduced phosphate supply for improved secretory production of heterologous proteins.


Figures

Figure 1
Figure 1
Physiological impact of reduced phosphate supply in chemostat cultivations.A. Schematic set-up of the Pi wash-out experiment. The gradual decrease of the feed supply rate (pump P1) was compensated by a gradual increase of the feed rate of a medium lacking any phosphate source (DMM-P, pump P2). The overall dilution rate was thus kept constant, and the residual phosphate in the culture was washed out. B. An overview on the impact of decreasing phosphate supply during the wash-out process. The insulin titers (IAP, blue circles) increased when the phosphate supply was restricted (pump A, red dashed line). C. representation of the biomass yield (black, 0.13-0.43 g/g), IAP productivity (blue, 0.196-0.392 mg/gh), glycerol yield (green, 0-0.615 mmol/mol), and ethanol yield (red, 0-12.68 mmol/mol), as a function of the supplied phosphate level in individual cultures. All four parameters were normalized to a range of zero (min. values) to one (max. values). D. radar plot representation of the biomass yield (green) and the corresponding IAP yield (blue).
Figure 2
Figure 2
A volcano plot representation of the differentially expressed genes in a pair-wise comparison of cultures growing at high phosphate level [22 mM] to low phosphate level [9.6 mM]. The significance cut-off was set to a FDR of 0.05 (-log(adj.P.val ≥ 1.3), the biological cut-off was set to a fold change of ± 2 fold (-1 ≥ logFC ≥ 1), the top 30 differentially expressed genes are labeled with their corresponding gene ID, the absolute fold change of all genes are represented by the circle size, the five different color codes used represent insignificant genes (grey), both biologically and statistically significant genes being up-regulated (red, B) and down-regulated (green, A) at [22 mM] Pi, statistically but not biologically significant genes being up-regulated (orange) and down-regulated (light green) at [22 mM] Pi, respectively. A GO slim enrichment analysis of the gene sets A and B revealed the over-representation of the pictured GO terms within the gene sets A and B (%), the group of genes with an unknown biological function for gene set A (26%) and gene set B (25%) was excluded from further analysis.
Figure 3
Figure 3
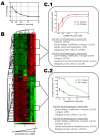
Identification of significant gene expression profiles in relation to the observed IAP expression dynamics. A. The insulin yield on biomass, as a function of supplied phosphate. B. a heat map of the hierarchical clustering analysis based on genes picturing a significant expression profile as a function of supplied phosphate; the lowest examined phosphate level [2.6 mM] was excluded from the SPA analysis; the color code represents the scaled expression values. C.1. Two clusters cA1 (263 genes) and cA2 (202 genes) were selected, harboring genes with declining expression profile with diminishing phosphate levels. The GO slim enrichment analysis identified each four categories, covering 66% (cA1) and 74% (cA2) of genes within each cluster.C.2. Two clusters cB1 (115 genes) and cB2 (78 genes) were selected, harboring genes that showed, similarly to the IAP yield, an increasing expression profile with decreasing phosphate levels. The GO slim enrichment analysis identified three (cB1) and four (cB2) enriched categories, covering 65% (cB1) and 74% (cB2) of gene within each cluster, respectively.
Figure 4
Figure 4
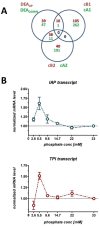
Mining the impact of phosphate scarcity by using complementary gene expression data sets. A. Venn diagram representing the overlapping genes identified with the DEA approach (comparison of cultures growing at low and high phosphate levels) and the SPA approach (consecutive analysis of gene expression patterns as a function of phosphate supply; gene numbers with increasing expression at low phosphate (dark red) and gene with decreasing expression at low phosphate (green) are highlighted. B. RT-PCR analysis of the transcript levels of insulin gene (blue) and the TPI1 gene (red) as a function of supplied phosphate; increased levels of the IAP transcript were measured under low phosphate levels; the mRNA levels are normalized to their initial quantities at high phosphate levels [33 mM]; cultures grown under limited phosphate supply [2.6 mM] showed decreased IAP and TPI1 transcript levels.
Figure 5
Figure 5
A schematic view on the inter-connection of cellular responses during growth on low phosphate levels. All labeled genes (left hand side) and illustrated proteins (right hand side) showed significantly up-regulated transcript levels when cells were grown under low phosphate levels [9.6 mM]. The up-regulated pathways included the glycerol biosynthesis (orange background), the lower part of glucose fermentation, being significantly increased downstream from the pyruvate decarboxylation step (blue background), the phosphatidylinositol biosynthesis and the lower part of inositol phosphate biosynthesis pathways (green background), yielding in heptakisphosphate (IP7) which has been shown to regulate the inhibitory activity of Pho81, thus allowing the transcription factor Pho4 to access the nucleus and induce the PHO pathway. Metabolites: Glc glucose, G6P glucose-6-phosphate, F1, 2 bP fructose-1,2-bisphosphate, DHAP dihydroxyacetone, Gro-3-P glycerol-3-phosphate, GAP glyceraldehyde-3-phosphate, AcAld acetaldehyde, Ino-3-P inositol-3-phosphate, PI phosphatidylinositol, IP3 inositol triphosphate, IP7 inositol heptakisphosphate, GroPIns glycerophosphoinositol, LPA lyso-phosphatidic acid.

Similar articles

Cited by

References

    1. Porro D, Gasser B, Fossati T, Maurer M, Branduardi P, Sauer M. et al.Production of recombinant proteins and metabolites in yeasts: when are these systems better than bacterial production systems? Applied Microbiology and Biotechnology. 2011;89:939–48. doi: 10.1007/s00253-010-3019-z. - DOI - PubMed
    1. Walsh G. Therapeutic insulins and their large-scale manufacture. Applied Microbiology and Biotechnology. 2005;67:151–9. doi: 10.1007/s00253-004-1809-x. - DOI - PubMed
    1. Sauer M, Porro D, Mattanovich D, Branduardi P. Microbial production of organic acids: expanding the markets. Trends in Biotechnology. 2008;26:100–8. doi: 10.1016/j.tibtech.2007.11.006. - DOI - PubMed
    1. Jarboe LR, Zhang X, Wang X, Moore JC, Shanmugam KT, Ingram LO. Metabolic engineering for production of biorenewable fuels and chemicals: contributions of synthetic biology. Journal of Biomedicine & Biotechnology. 2010;2010:761042. - PMC - PubMed
    1. Otero JM, Nielsen J. Industrial systems biology. Biotechnology and Bioengineering. 2010;105:439–60. doi: 10.1002/bit.22592. - DOI - PubMed

Publication types

MeSH terms