

Efficiency, error and yield in light-directed maskless synthesis of DNA microarrays
- PMID: 22152062
- PMCID: PMC3269373
- DOI: 10.1186/1477-3155-9-57
Efficiency, error and yield in light-directed maskless synthesis of DNA microarrays
Abstract
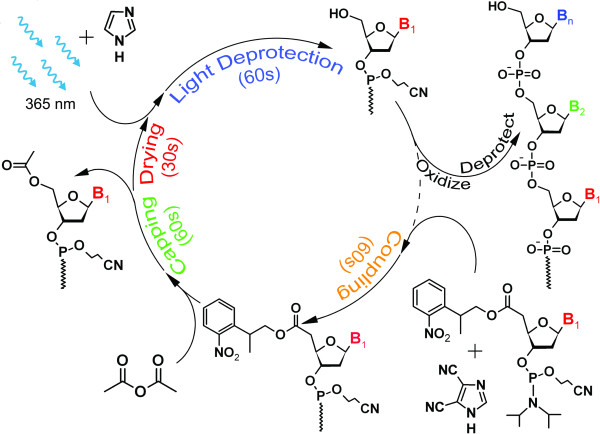
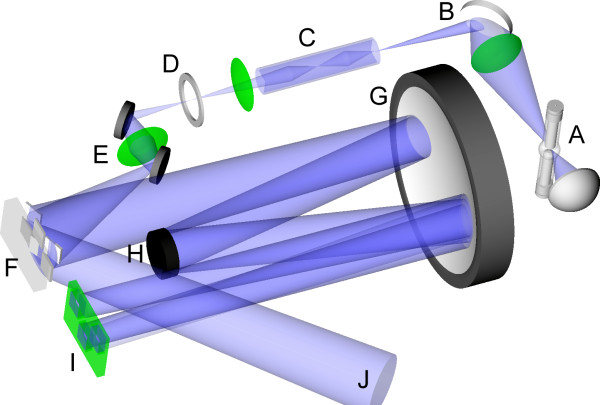
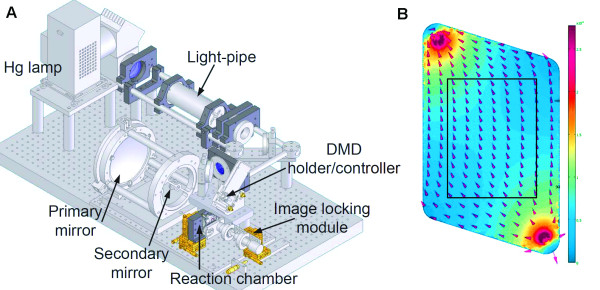
Background: Light-directed in situ synthesis of DNA microarrays using computer-controlled projection from a digital micromirror device--maskless array synthesis (MAS)--has proved to be successful at both commercial and laboratory scales. The chemical synthetic cycle in MAS is quite similar to that of conventional solid-phase synthesis of oligonucleotides, but the complexity of microarrays and unique synthesis kinetics on the glass substrate require a careful tuning of parameters and unique modifications to the synthesis cycle to obtain optimal deprotection and phosphoramidite coupling. In addition, unintended deprotection due to scattering and diffraction introduce insertion errors that contribute significantly to the overall error rate.
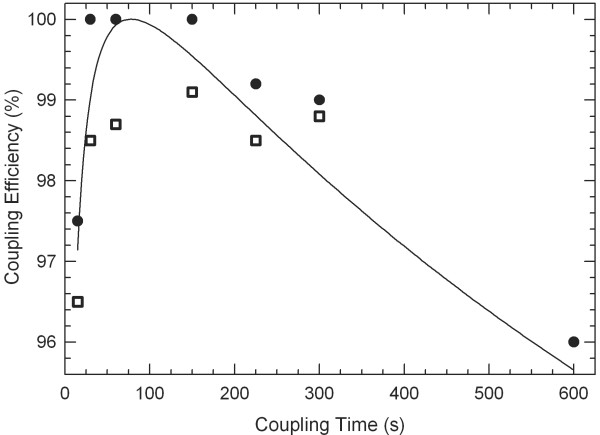
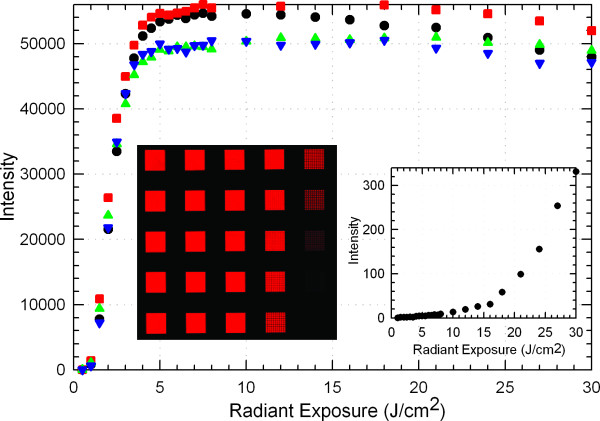
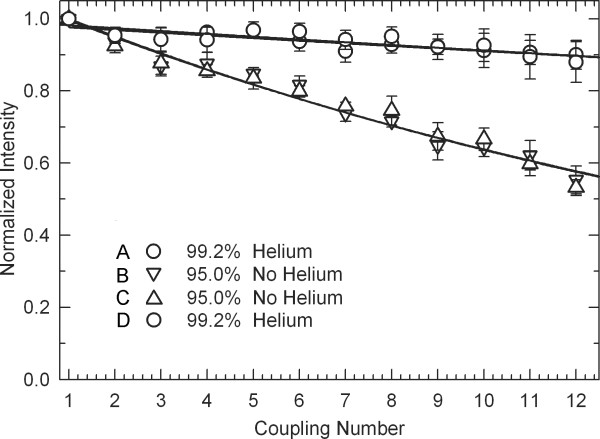
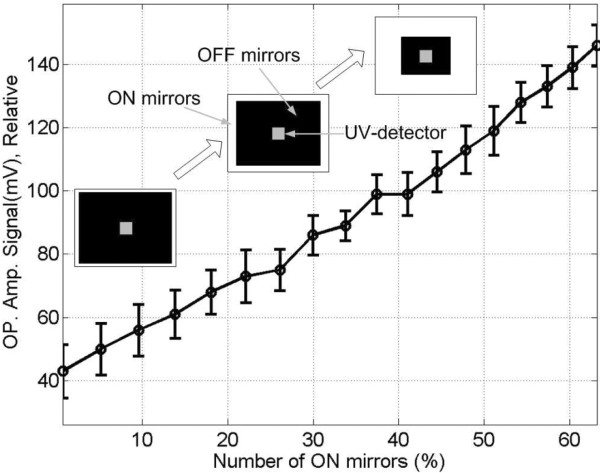
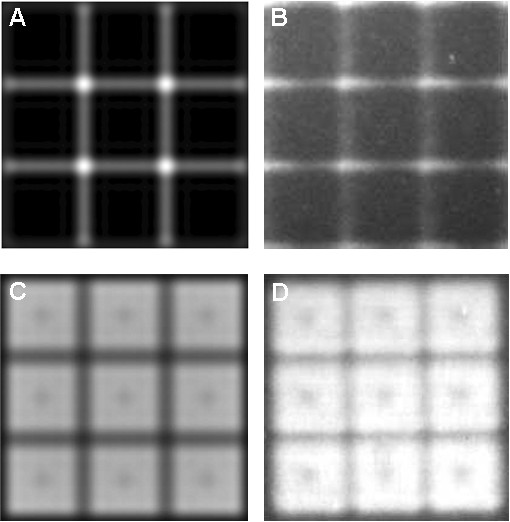
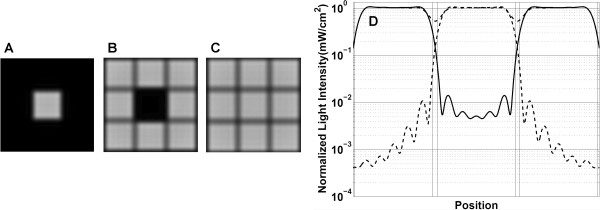
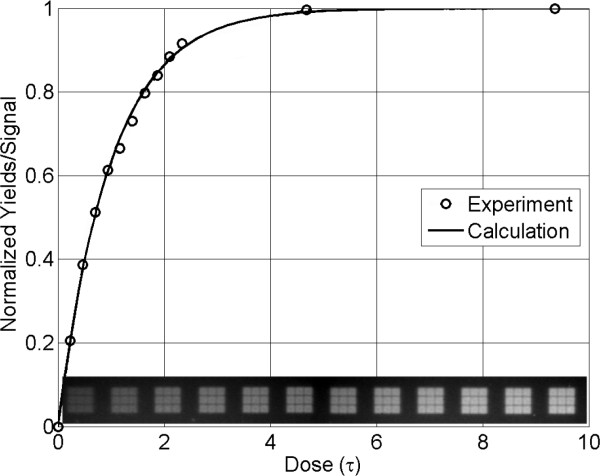
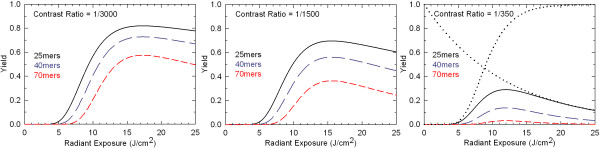
Results: Stepwise phosphoramidite coupling yields have been greatly improved and are now comparable to those obtained in solid phase synthesis of oligonucleotides. Extended chemical exposure in the synthesis of complex, long oligonucleotide arrays result in lower--but still high--final average yields which approach 99%. The new synthesis chemistry includes elimination of the standard oxidation until the final step, and improved coupling and light deprotection. Coupling Insertions due to stray light are the limiting factor in sequence quality for oligonucleotide synthesis for gene assembly. Diffraction and local flare are by far the largest contributors to loss of optical contrast.
Conclusions: Maskless array synthesis is an efficient and versatile method for synthesizing high density arrays of long oligonucleotides for hybridization- and other molecular binding-based experiments. For applications requiring high sequence purity, such as gene assembly, diffraction and flare remain significant obstacles, but can be significantly reduced with straightforward experimental strategies.
Figures
Similar articles
-
Express photolithographic DNA microarray synthesis with optimized chemistry and high-efficiency photolabile groups.J Nanobiotechnology. 2016 Mar 2;14:14. doi: 10.1186/s12951-016-0166-0. J Nanobiotechnology. 2016. PMID: 26936369 Free PMC article.
-
Maskless fabrication of light-directed oligonucleotide microarrays using a digital micromirror array.Nat Biotechnol. 1999 Oct;17(10):974-8. doi: 10.1038/13664. Nat Biotechnol. 1999. PMID: 10504697
-
Gene expression analysis using oligonucleotide arrays produced by maskless photolithography.Genome Res. 2002 Nov;12(11):1749-55. doi: 10.1101/gr.362402. Genome Res. 2002. PMID: 12421762 Free PMC article.
-
Strategies in the preparation of DNA oligonucleotide arrays for diagnostic applications.Curr Med Chem. 2001 Aug;8(10):1213-44. doi: 10.2174/0929867013372463. Curr Med Chem. 2001. PMID: 11472237 Review.
-
High density synthetic oligonucleotide arrays.Nat Genet. 1999 Jan;21(1 Suppl):20-4. doi: 10.1038/4447. Nat Genet. 1999. PMID: 9915496 Review.
Cited by
-
A Characterization of the DNA Data Storage Channel.Sci Rep. 2019 Jul 4;9(1):9663. doi: 10.1038/s41598-019-45832-6. Sci Rep. 2019. PMID: 31273225 Free PMC article.
-
Express photolithographic DNA microarray synthesis with optimized chemistry and high-efficiency photolabile groups.J Nanobiotechnology. 2016 Mar 2;14:14. doi: 10.1186/s12951-016-0166-0. J Nanobiotechnology. 2016. PMID: 26936369 Free PMC article.
-
Sequence Preference and Initiator Promiscuity for De Novo DNA Synthesis by Terminal Deoxynucleotidyl Transferase.ACS Synth Biol. 2021 Jul 16;10(7):1750-1760. doi: 10.1021/acssynbio.1c00142. Epub 2021 Jun 22. ACS Synth Biol. 2021. PMID: 34156829 Free PMC article.
-
Simultaneous light-directed synthesis of mirror-image microarrays in a photochemical reaction cell with flare suppression.Anal Chem. 2013 Sep 17;85(18):8513-7. doi: 10.1021/ac4024318. Epub 2013 Sep 6. Anal Chem. 2013. PMID: 23968455 Free PMC article.
-
Long-Term Consumption of a Sugar-Sweetened Soft Drink in Combination with a Western-Type Diet Is Associated with Morphological and Molecular Changes of Taste Markers Independent of Body Weight Development in Mice.Nutrients. 2022 Jan 29;14(3):594. doi: 10.3390/nu14030594. Nutrients. 2022. PMID: 35276952 Free PMC article.
References
-
- Fodor S, Read J, Pirrung M, Stryer L, Lu A, Solas D. Light-directed, spatially addressable parallel chemical synthesis. Science. 1991;251:767–773. - PubMed
-
- Singh-Gasson S, Green RD, Yue YJ, Nelson C, Blattner F, Sussman MR, Cerrina F. Maskless fabrication of light-directed oligonucleotide microarrays using a digital micromirror array. Nature Biotechnology. 1999;17:974–978. - PubMed
-
- Lackey JG, Mitra D, Somoza MM, Cerrina F, Damha MJ. Acetal Levulinyl Ester (ALE) Groups for 2'-Hydroxyl Protection of Ribonucleosides in the Synthesis of Oligoribonucleotides on Glass and Microarrays. Journal of the American Chemical Society. 2009;131:8496–8502. - PubMed
-
- Lackey JG, Somoza MM, Mitra D, Cerrina F, Damha MJ. In-situ chemical synthesis of rU-DNA chimeras on chips and enzymatic recognition. Chim Oggi-Chem Today. 2009;27:30–33.
-
- Pellois JP, Zhou X, Srivannavit O, Zhou T, Gulari E, Gao X. Individually addressable parallel peptide synthesis on microchips. 2002. pp. 922–926. - PubMed
Publication types
MeSH terms
Substances
Grants and funding
LinkOut - more resources
Full Text Sources
Other Literature Sources
