

Fast and accurate methods for phylogenomic analyses
- PMID: 22152123
- PMCID: PMC3283310
- DOI: 10.1186/1471-2105-12-S9-S4
Fast and accurate methods for phylogenomic analyses
Abstract
Background: Species phylogenies are not estimated directly, but rather through phylogenetic analyses of different gene datasets. However, true gene trees can differ from the true species tree (and hence from one another) due to biological processes such as horizontal gene transfer, incomplete lineage sorting, and gene duplication and loss, so that no single gene tree is a reliable estimate of the species tree. Several methods have been developed to estimate species trees from estimated gene trees, differing according to the specific algorithmic technique used and the biological model used to explain differences between species and gene trees. Relatively little is known about the relative performance of these methods.
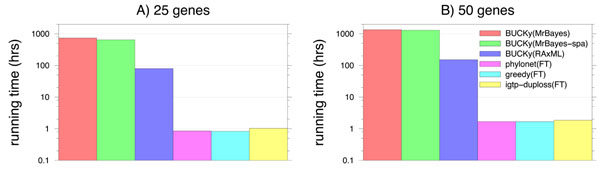
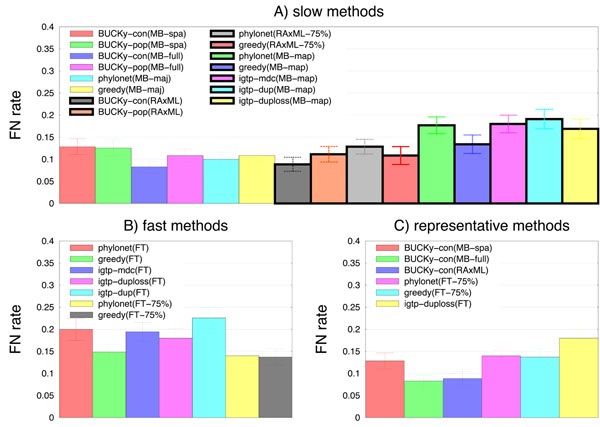
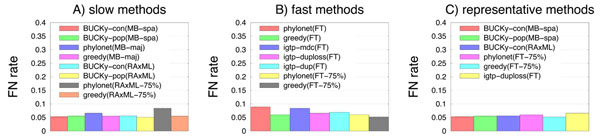
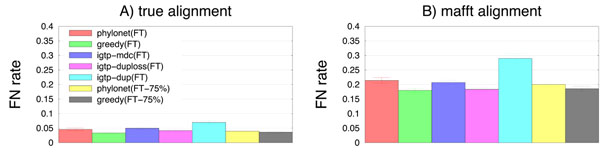
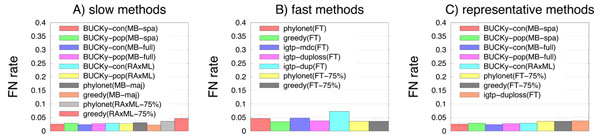
Results: We report on a study evaluating several different methods for estimating species trees from sequence datasets, simulating sequence evolution under a complex model including indels (insertions and deletions), substitutions, and incomplete lineage sorting. The most important finding of our study is that some fast and simple methods are nearly as accurate as the most accurate methods, which employ sophisticated statistical methods and are computationally quite intensive. We also observe that methods that explicitly consider errors in the estimated gene trees produce more accurate trees than methods that assume the estimated gene trees are correct.
Conclusions: Our study shows that highly accurate estimations of species trees are achievable, even when gene trees differ from each other and from the species tree, and that these estimations can be obtained using fairly simple and computationally tractable methods.
Figures
Similar articles
-
Estimating optimal species trees from incomplete gene trees under deep coalescence.J Comput Biol. 2012 Jun;19(6):591-605. doi: 10.1089/cmb.2012.0037. J Comput Biol. 2012. PMID: 22697236
-
Weighted Statistical Binning: Enabling Statistically Consistent Genome-Scale Phylogenetic Analyses.PLoS One. 2015 Jun 18;10(6):e0129183. doi: 10.1371/journal.pone.0129183. eCollection 2015. PLoS One. 2015. PMID: 26086579 Free PMC article.
-
Naive binning improves phylogenomic analyses.Bioinformatics. 2013 Sep 15;29(18):2277-84. doi: 10.1093/bioinformatics/btt394. Epub 2013 Jul 9. Bioinformatics. 2013. PMID: 23842808
-
Recent progress on methods for estimating and updating large phylogenies.Philos Trans R Soc Lond B Biol Sci. 2022 Oct 10;377(1861):20210244. doi: 10.1098/rstb.2021.0244. Epub 2022 Aug 22. Philos Trans R Soc Lond B Biol Sci. 2022. PMID: 35989607 Free PMC article. Review.
-
Challenges in Species Tree Estimation Under the Multispecies Coalescent Model.Genetics. 2016 Dec;204(4):1353-1368. doi: 10.1534/genetics.116.190173. Genetics. 2016. PMID: 27927902 Free PMC article. Review.
Cited by
-
A scalability study of phylogenetic network inference methods using empirical datasets and simulations involving a single reticulation.BMC Bioinformatics. 2016 Oct 13;17(1):422. doi: 10.1186/s12859-016-1277-1. BMC Bioinformatics. 2016. PMID: 27737628 Free PMC article.
-
The performance of coalescent-based species tree estimation methods under models of missing data.BMC Genomics. 2018 May 8;19(Suppl 5):286. doi: 10.1186/s12864-018-4619-8. BMC Genomics. 2018. PMID: 29745854 Free PMC article.
-
Improvements to a class of distance matrix methods for inferring species trees from gene trees.J Comput Biol. 2012 Jun;19(6):632-49. doi: 10.1089/cmb.2012.0042. J Comput Biol. 2012. PMID: 22697239 Free PMC article.
-
Phylogenomic species tree estimation in the presence of incomplete lineage sorting and horizontal gene transfer.BMC Genomics. 2015;16 Suppl 10(Suppl 10):S1. doi: 10.1186/1471-2164-16-S10-S1. Epub 2015 Oct 2. BMC Genomics. 2015. PMID: 26450506 Free PMC article.
-
SimPhy: Phylogenomic Simulation of Gene, Locus, and Species Trees.Syst Biol. 2016 Mar;65(2):334-44. doi: 10.1093/sysbio/syv082. Epub 2015 Nov 1. Syst Biol. 2016. PMID: 26526427 Free PMC article.
References
-
- Maddison WP. Gene trees in species trees. Syst Biol. 1997;46:523–536. doi: 10.1093/sysbio/46.3.523. - DOI
-
- Kingman JFC. The coalescent. Stoch Proc Appl. 1982;13:235–248. doi: 10.1016/0304-4149(82)90011-4. - DOI
-
- Zhang L. From Gene Trees to Species Trees II: Species Tree Inference by Minimizing Deep Coalescence Events. IEEE/ACM Trans Comp Biol Bioinf. 2011;8:1685–1691. (PrePrints) - PubMed
Publication types
MeSH terms
LinkOut - more resources
Full Text Sources
