. 2011 Dec 12:6:22.
doi: 10.1186/1747-1028-6-22.

Live cell division dynamics monitoring in 3D large spheroid tumor models using light sheet microscopy

Affiliations

Live cell division dynamics monitoring in 3D large spheroid tumor models using light sheet microscopy

Corinne Lorenzo et al. Cell Div. .

Abstract

Background: Multicellular tumor spheroids are models of increasing interest for cancer and cell biology studies. They allow considering cellular interactions in exploring cell cycle and cell division mechanisms. However, 3D imaging of cell division in living spheroids is technically challenging and has never been reported.

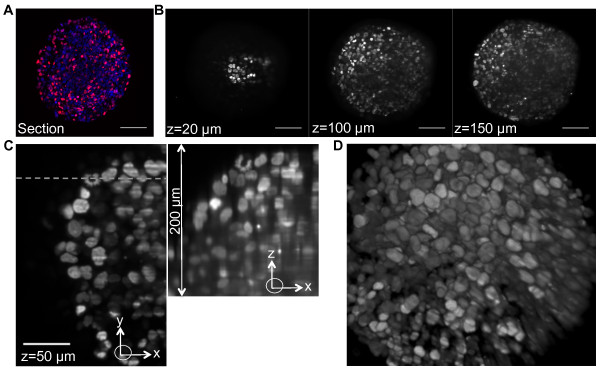
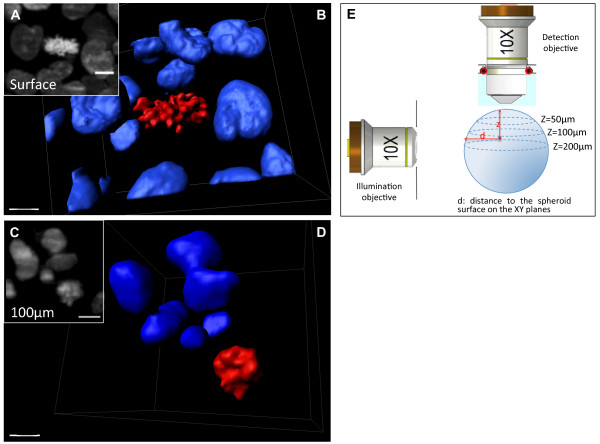
Results: Here, we report a major breakthrough based on the engineering of multicellular tumor spheroids expressing an histone H2B fluorescent nuclear reporter protein, and specifically designed sample holders to monitor live cell division dynamics in 3D large spheroids using an home-made selective-plane illumination microscope.

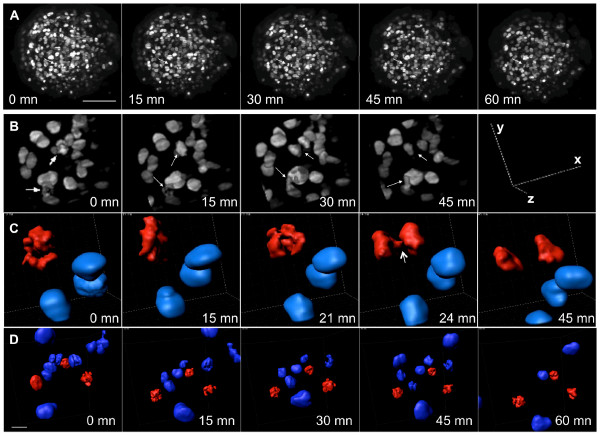
Conclusions: As illustrated using the antimitotic drug, paclitaxel, this technological advance paves the way for studies of the dynamics of cell divion processes in 3D and more generally for the investigation of tumor cell population biology in integrated system as the spheroid model.


Figures

Figure 1
Figure 1
SPIM imaging of spheroids of HCT116 colon carcinoma cells expressing a histone H2B-HcRed fusion protein. A: A frozen section from the center of an H2B-HcRed-expressing HCT116 cell spheroid. DNA is stained with DAPI. Scale bar, 100 μm. B: XY planes at the indicated z positions of the 200 μm z-stack shown in Additional file 4 (10× objective, NA = 0.3). C: Region of the XY plane at 50 μm in depth in the z-stack (left). The dashed line indicates the Y position of the XZ plane (right), parallel to the detection axis. Scale bar, 100 μm. D: 3D visualization of the z-stack presented in the Additional file 4.
Figure 2
Figure 2
Imaging and 3D reconstruction of interphase and mitotic nuclei within a fixed H2B-HcRed-expressing spheroid. A: Magnification of one frame of the z-stack presented in Additional file 4 showing a mitotic cell located on the surface of the spheroid detected at z = 30 μm. Scale bar, 15 μm. B: 3D reconstruction of the region of the stack corresponding to the frame shown in a: blue isosurfaces correspond to interphase nuclei and red isosurfaces to mitotic condensed chromosomes. Scale bar: 7 μm. C: Magnification of a region of a z-stack at z = 150 μm showing a mitotic cell located at 100 μm from the surface of the spheroid. Scale bar, 10 μm. D: 3D reconstruction of the region of the stack corresponding to C. Scale bar: 7 μm. E: Sketch showing how the position of the mitotic cells are defined with regard to the spheroid surface and to the z position in the detection axis.
Figure 3
Figure 3
Live spheroid imaging by SPIM. A: Maximum projection of z-stacks of an H2B-HcRed-expressing spheroid recorded at the indicated times. The images are taken from Additional file 9. Stacks of 100 slices were recorded by SPIM (10× objective, NA = 0.3) every 3 minutes with a slice spacing of 1 μm. The white arrow shows a dividing cell. Scale bar, 100 μm. B: 3D visualization of an enlarged region of the spheroid at the indicated times. The progress of mitosis can be seen in two cells (arrows). C: 3D reconstruction of the interphase nuclei (blue) and condensed chromosomes (red) of one mitotic cell within the 4D stack. The arrow indicates a sister chromatid disjunction. Scale bar, 10 μm. D: 3D reconstruction of a region of a spheroid treated with paclitaxel showing three mitotic cells (red) blocked in mitosis over 60 minutes. Scale bar, 20 μm.

References

    1. Wang F, Hansen RK, Radisky D, Yoneda T, Barcellos-Hoff MH, Petersen OW, Turley EA, Bissell MJ. Phenotypic reversion or death of cancer cells by altering signaling pathways in three-dimensional contexts. Journal of the National Cancer Institute. 2002;94:1494–1503. doi: 10.1093/jnci/94.19.1494. - DOI - PMC - PubMed
    1. Wang F, Weaver VM, Petersen OW, Larabell CA, Dedhar S, Briand P, Lupu R, Bissell MJ. Reciprocal interactions between beta1-integrin and epidermal growth factor receptor in three-dimensional basement membrane breast cultures: a different perspective in epithelial biology. Proceedings of the National Academy of Sciences of the United States of America. 1998;95:14821–14826. doi: 10.1073/pnas.95.25.14821. - DOI - PMC - PubMed
    1. Minc N, Burgess D, Chang F. Influence of cell geometry on division-plane positioning. Cell. 2011;144:414–426. doi: 10.1016/j.cell.2011.01.016. - DOI - PMC - PubMed
    1. Thery M, Racine V, Pepin A, Piel M, Chen Y, Sibarita JB, Bornens M. The extracellular matrix guides the orientation of the cell division axis. Nat Cell Biol. 2005;7:947–953. doi: 10.1038/ncb1307. - DOI - PubMed
    1. Desoize B, Jardillier J. Multicellular resistance: a paradigm for clinical resistance? Critical reviews in oncology/hematology. 2000;36:193–207. doi: 10.1016/S1040-8428(00)00086-X. - DOI - PubMed