

Beverage intake and obesity in Australian children
- PMID: 22152289
- PMCID: PMC3286426
- DOI: 10.1186/1743-7075-8-87
Beverage intake and obesity in Australian children
Abstract
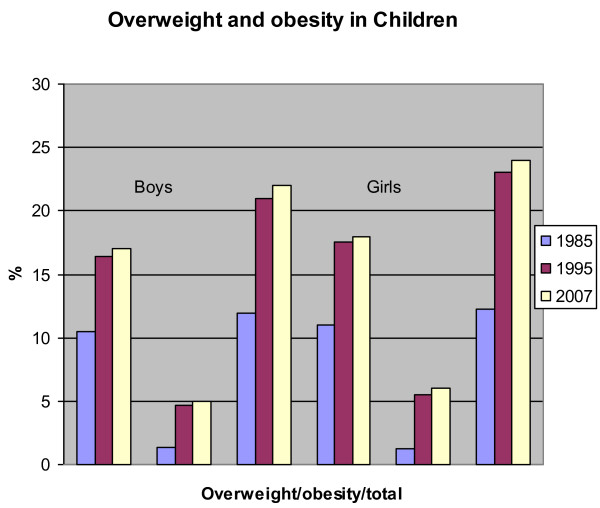
Background: There have been increases in the obesity and overweight rates in Australian children over the past 25 years and it has been suggested that sugar sweetened beverages (SSB) have played a role in this increase.
Objective: The objectives of this study were to: (1) examine SSB intakes in the 2007 Australian Children's Nutrition and Physical Activity Survey (2) relate SSB intake to rates of overweight and obesity, socio-economic status (SES), TV viewing time, and activity levels and (3) compare 2007 SSB intakes with data from the 1995 National Nutrition Survey.
Design: A computer assisted 24 h dietary recall in 4,400 children aged 2-16 years was performed.
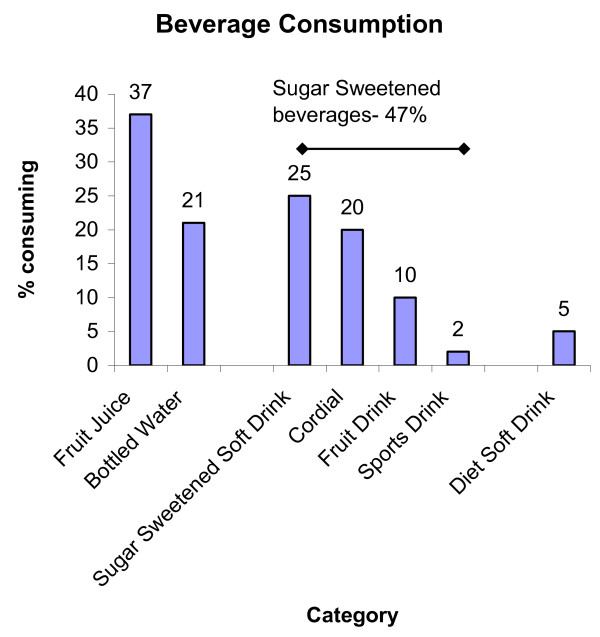
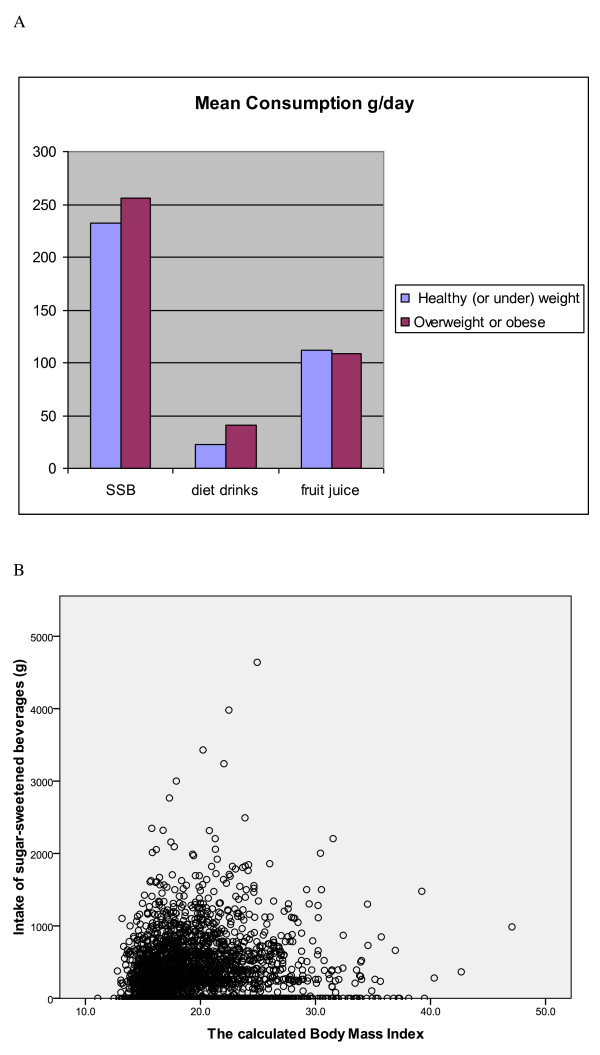
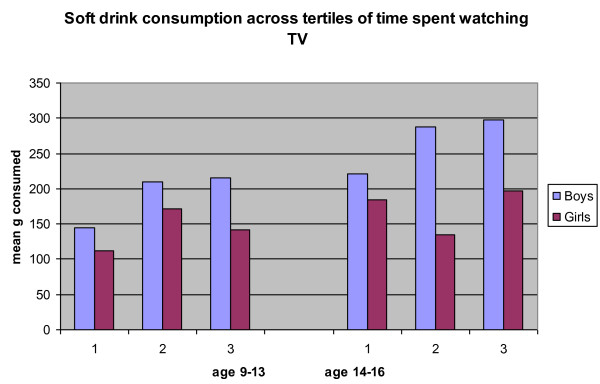
Results: In the 2007 survey 47% of all children reported drinking SSBs with 25% consuming sugar sweetened soft drinks on the day of the survey. The mean consumption of soft drink was 436 g/d/consumer. Activity levels were unrelated to SSB consumption. Television viewing was positively related to soft drink consumption with a difference of 55 g/day from bottom to top tertile of time spent TV viewing (p = 0.015) in children aged 9-16 years. 55% of SSB consumption occurred at home and 10% occurred at school. Lower SES status was associated with a greater prevalence of SSB consumption- 30% for the lowest SES quartile vs 19% in the highest quartile. The proportion of overweight who consumed SSBs (which excludes 100% fruit) was not different from the non-overweight children although the proportion of SSB consumers in the 6% of children who were obese was significant compared with the non-overweight children (59% vs 47%, p < 0.05). In the 2007 survey 23% of children were overweight (17%) or obese (6%) while in the 1995 survey this figure was 21%. The proportion of children consuming SSBs in 1995 and 2007 for selected age groups were: 2-3 years - 25.8% and 12.8% respectively and 4-7 years - 33.6% and 20.5% respectively (p < 0.001 for both).
Conclusions: This cross-sectional data set provides evidence that SSB consumption for Australian children is still high despite the decrease since 1995 in some age groups. It provides little support to conclude that overweight in children is currently being driven by excessive SSB consumption although it may be factor in some obese children. Conclusions are limited by the cross sectional nature of the study.
Figures
Similar articles
-
Dietary salt intake, sugar-sweetened beverage consumption, and obesity risk.Pediatrics. 2013 Jan;131(1):14-21. doi: 10.1542/peds.2012-1628. Epub 2012 Dec 10. Pediatrics. 2013. PMID: 23230077
-
Beverage intake among preschool children and its effect on weight status.Pediatrics. 2006 Oct;118(4):e1010-8. doi: 10.1542/peds.2005-2348. Pediatrics. 2006. PMID: 17015497
-
Consumption patterns of sugar-sweetened beverages in the United States.J Acad Nutr Diet. 2013 Jan;113(1):43-53. doi: 10.1016/j.jand.2012.09.016. J Acad Nutr Diet. 2013. PMID: 23260723 Free PMC article.
-
Who drinks sugar sweetened beverages and juice? An Australian population study of behaviour, awareness and attitudes.BMC Obes. 2019 Jan 3;6:1. doi: 10.1186/s40608-018-0224-2. eCollection 2019. BMC Obes. 2019. PMID: 30619612 Free PMC article.
-
The negative impact of sugar-sweetened beverages on children's health: an update of the literature.BMC Obes. 2018 Feb 20;5:6. doi: 10.1186/s40608-017-0178-9. eCollection 2018. BMC Obes. 2018. PMID: 29484192 Free PMC article. Review.
Cited by
-
Prospective Associations of Sugar-Sweetened Beverage Consumption During Adolescence with Body Composition and Bone Mass at Early Adulthood.J Nutr. 2022 Feb 8;152(2):399-407. doi: 10.1093/jn/nxab389. J Nutr. 2022. PMID: 34791346 Free PMC article.
-
Technological tools for assessing children's food intake: a scoping review.J Nutr Sci. 2023 Apr 11;12:e43. doi: 10.1017/jns.2023.27. eCollection 2023. J Nutr Sci. 2023. PMID: 37123397 Free PMC article.
-
Prospective associations between sugar-sweetened beverage intakes and cardiometabolic risk factors in adolescents.Am J Clin Nutr. 2013 Aug;98(2):327-34. doi: 10.3945/ajcn.112.051383. Epub 2013 May 29. Am J Clin Nutr. 2013. PMID: 23719557 Free PMC article.
-
Ultra-processed foods and recommended intake levels of nutrients linked to non-communicable diseases in Australia: evidence from a nationally representative cross-sectional study.BMJ Open. 2019 Aug 28;9(8):e029544. doi: 10.1136/bmjopen-2019-029544. BMJ Open. 2019. PMID: 31462476 Free PMC article.
-
Association of Dietary Sugars and Sugar-Sweetened Beverage Intake with Obesity in Korean Children and Adolescents.Nutrients. 2016 Jan 8;8(1):31. doi: 10.3390/nu8010031. Nutrients. 2016. PMID: 26761029 Free PMC article.
References
-
- Jacobson MF. Liquid Candy: How Soft Drinks are Harming Americans' Health. 2. CSPI, Washington DC 1998; 2005.
-
- Bray GA, Nielsen SJ, Popkin BM. Consumption of high-fructose corn syrup in beverages may play a role in the epidemic of obesity. Am J Clin Nutr. 2004;76:537–543. - PubMed
LinkOut - more resources
Full Text Sources
Miscellaneous
