

High-fat diet accelerates progression of osteoarthritis after meniscal/ligamentous injury
- PMID: 22152451
- PMCID: PMC3334649
- DOI: 10.1186/ar3529
High-fat diet accelerates progression of osteoarthritis after meniscal/ligamentous injury
Abstract
Introduction: Increasing obesity and type 2 diabetes, in part due to the high-fat (HF) Western diet, parallels an increased incidence of osteoarthritis (OA). This study was undertaken to establish a causal relation between the HF diet and accelerated OA progression in a mouse model and to determine the relative roles of weight gain and metabolic dysregulation in this progression.
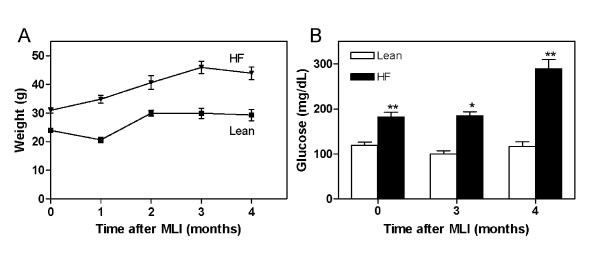
Methods: Five-week-old C57BL/6 mice were placed on HF (60% kcal) or low-fat (lean, 10% kcal) diets for 8 or 12 weeks before transecting the medial collateral ligament and excising a segment of the medial meniscus of the knee to initiate OA. One group was switched from lean to HF diet at the time of surgery.
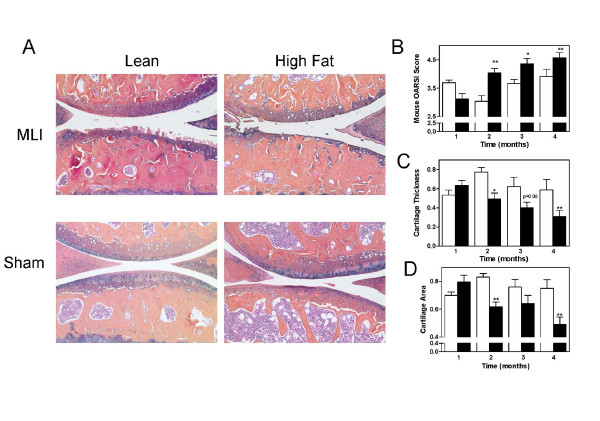
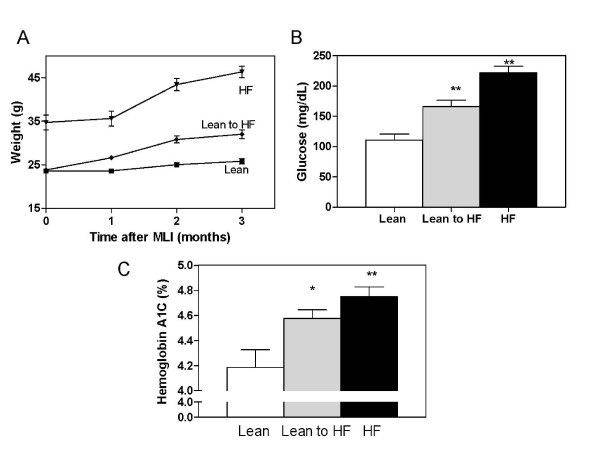
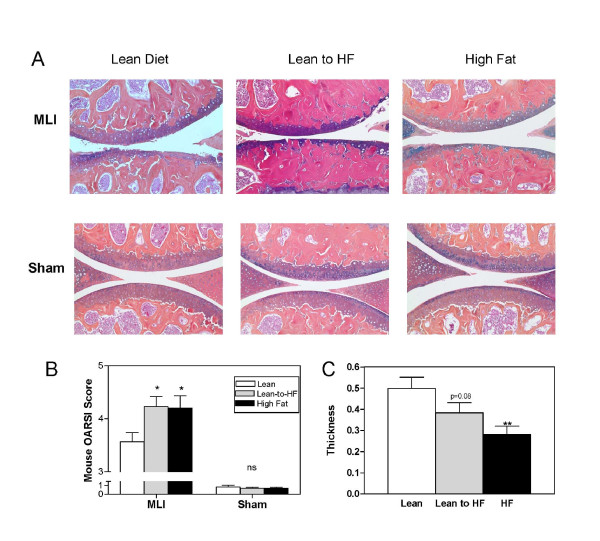
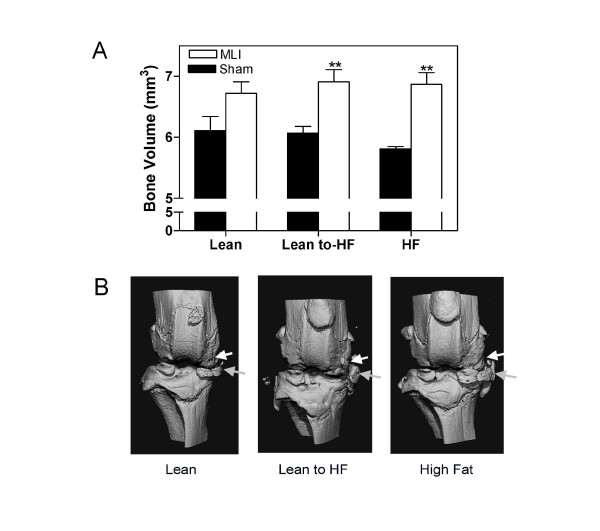
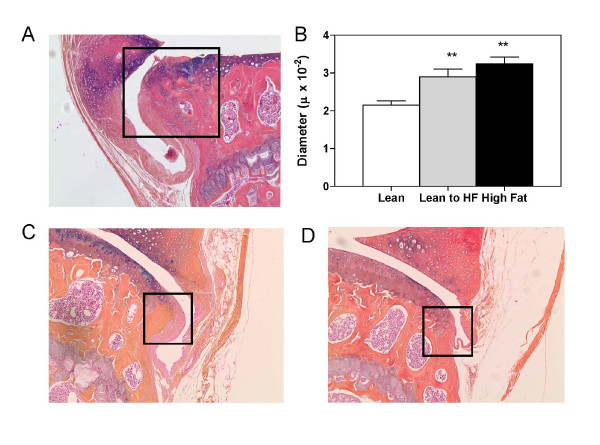
Results: Body weight of mice on the HF diet peaked at 45.9 ± 2.1 g compared with 29.9 ± 1.8 g for lean diets, with only those on the HF becoming diabetic. Severity of OA was greater in HF mice, evidenced by the Osteoarthritis Research Society International (OARSI) histopathology initiative scoring method for mice and articular cartilage thickness and area. To assess the importance of weight gain, short- and long-term HF diets were compared with the lean diet. Short- and long-term HF groups outweighed lean controls by 6.2 g and 20.5 g, respectively. Both HF groups became diabetic, and OA progression, evidenced by increased OARSI score, decreased cartilage thickness, and increased osteophyte diameter, was comparably accelerated relative to those of lean controls.
Conclusions: These results demonstrate that the HF diet accelerates progression of OA in a type 2 diabetic mouse model without correlation to weight gain, suggesting that metabolic dysregulation is a comorbid factor in OA-related cartilage degeneration.
Figures
Comment in
-
Osteoarthritis: the influence of obesity on OA-does size matter or is metabolic dysfunction more important?Nat Rev Rheumatol. 2012 Jan 24;8(2):61. doi: 10.1038/nrrheum.2011.221. Nat Rev Rheumatol. 2012. PMID: 22270076 No abstract available.
Similar articles
-
Correlation network analysis shows divergent effects of a long-term, high-fat diet and exercise on early stage osteoarthritis phenotypes in mice.J Sport Health Sci. 2020 Mar;9(2):119-131. doi: 10.1016/j.jshs.2019.05.008. Epub 2019 May 24. J Sport Health Sci. 2020. PMID: 32099720 Free PMC article.
-
Accelerated post traumatic osteoarthritis in a dual injury murine model.Osteoarthritis Cartilage. 2019 Dec;27(12):1800-1810. doi: 10.1016/j.joca.2019.05.027. Epub 2019 Jul 5. Osteoarthritis Cartilage. 2019. PMID: 31283983
-
The role of excessive body weight and meniscal instability in the progression of osteoarthritis in a rat model.Knee. 2018 Dec;25(6):1151-1156. doi: 10.1016/j.knee.2018.07.009. Epub 2018 Aug 13. Knee. 2018. PMID: 30115587
-
Pleiotropic Functions of High Fat Diet in the Etiology of Osteoarthritis.PLoS One. 2016 Sep 9;11(9):e0162794. doi: 10.1371/journal.pone.0162794. eCollection 2016. PLoS One. 2016. PMID: 27611831 Free PMC article.
-
Peroxisome proliferator-activated receptor δ promotes the progression of posttraumatic osteoarthritis in a mouse model.Arthritis Rheumatol. 2015 Feb;67(2):454-64. doi: 10.1002/art.38915. Arthritis Rheumatol. 2015. PMID: 25331977
Cited by
-
Consequences of metabolic and oxidative modifications of cartilage tissue.Nat Rev Rheumatol. 2015 Sep;11(9):521-9. doi: 10.1038/nrrheum.2015.70. Epub 2015 Jun 2. Nat Rev Rheumatol. 2015. PMID: 26034834 Free PMC article. Review.
-
Free Fatty Acids in Bone Pathophysiology of Rheumatic Diseases.Front Immunol. 2019 Dec 3;10:2757. doi: 10.3389/fimmu.2019.02757. eCollection 2019. Front Immunol. 2019. PMID: 31849953 Free PMC article.
-
Interactions Between Diabetes Mellitus and Osteoarthritis: From Animal Studies to Clinical Data.JBMR Plus. 2022 Apr 23;6(5):e10626. doi: 10.1002/jbm4.10626. eCollection 2022 May. JBMR Plus. 2022. PMID: 35509632 Free PMC article. Review.
-
Dietary Fat Intake and Radiographic Progression of Knee Osteoarthritis: Data From the Osteoarthritis Initiative.Arthritis Care Res (Hoboken). 2017 Mar;69(3):368-375. doi: 10.1002/acr.22952. Arthritis Care Res (Hoboken). 2017. PMID: 27273934 Free PMC article.
-
Osteoarthritis-like pathologic changes in the knee joint induced by environmental disruption of circadian rhythms is potentiated by a high-fat diet.Sci Rep. 2015 Nov 20;5:16896. doi: 10.1038/srep16896. Sci Rep. 2015. PMID: 26584570 Free PMC article.
References
-
- Arthritis as a potential barrier to physical activity among adults with diabetes: United States, 2005 and 2007. MMWR Morb Mortal Wkly Rep. 2008;57:486–489. - PubMed
Publication types
MeSH terms
Substances
Grants and funding
LinkOut - more resources
Full Text Sources
Other Literature Sources
Research Materials
Miscellaneous
