. 2011 Dec 9;44(5):770-84.
doi: 10.1016/j.molcel.2011.10.012.

FOXP3 orchestrates H4K16 acetylation and H3K4 trimethylation for activation of multiple genes by recruiting MOF and causing displacement of PLU-1

Affiliations

FOXP3 orchestrates H4K16 acetylation and H3K4 trimethylation for activation of multiple genes by recruiting MOF and causing displacement of PLU-1

Hiroto Katoh et al. Mol Cell. .

Abstract

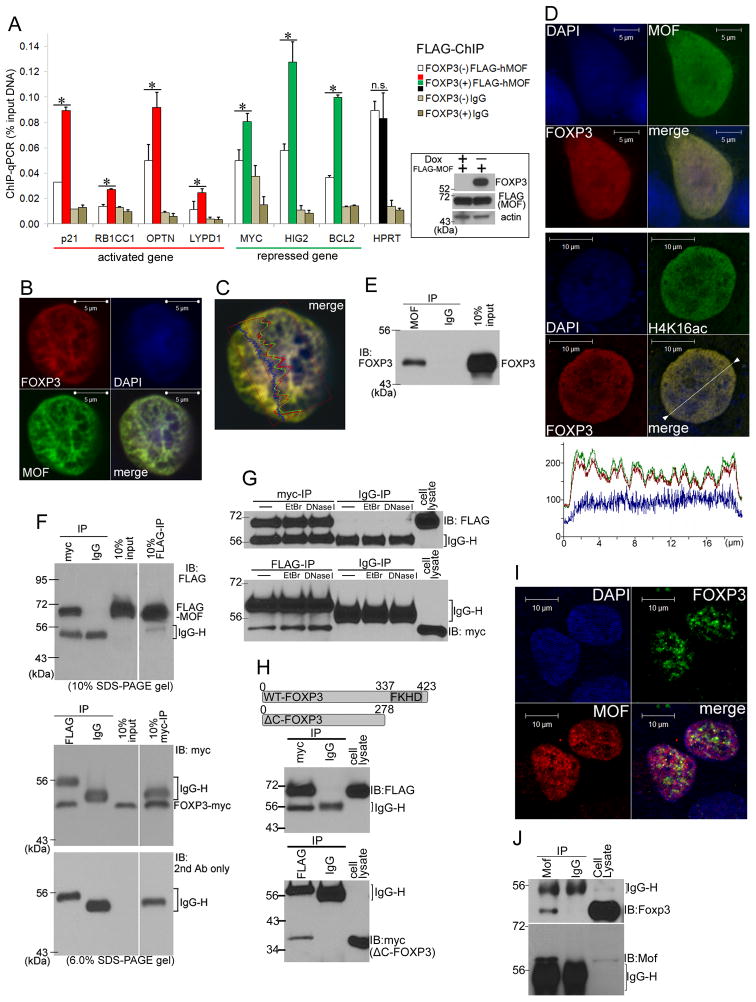
Both H4K16 acetylation and H3K4 trimethylation are required for gene activation. However, it is still largely unclear how these modifications are orchestrated by transcriptional factors. Here, we analyzed the mechanism of the transcriptional activation by FOXP3, an X-linked suppressor of autoimmune diseases and cancers. FOXP3 binds near transcriptional start sites of its target genes. By recruiting MOF and displacing histone H3K4 demethylase PLU-1, FOXP3 increases both H4K16 acetylation and H3K4 trimethylation at the FOXP3-associated chromatins of multiple FOXP3-activated genes. RNAi-mediated silencing of MOF reduced both gene activation and tumor suppression by FOXP3, while both somatic mutations in clinical cancer samples and targeted mutation of FOXP3 in mouse prostate epithelial cells disrupted nuclear localization of MOF. Our data demonstrate a pull-push model in which a single transcription factor orchestrates two epigenetic alterations necessary for gene activation and provide a mechanism for somatic inactivation of the FOXP3 protein function in cancer cells.


Figures

Fig. 1
Fig. 1. FOXP3-ChIP-seq analysis identified direct target genes of FOXP3 in MCF7 cell
(A) Distribution of FOXP3-binding sites revealed by ChIP-seq in relation to TSS of genes. X-axis represents the distance between ChIP-peaks and TSSs of genes, Y-axis indicate the number of binding sites. (B) ChIP-seq identified 4,067 genes which were directly bound by FOXP3 between −2kbp and +2kbp from their TSSs in the MCF7 cell, among which 270 were down-regulated while 575 were up-regulated by FOXP3 (genes are listed in Supplemental Table S1 and S2). (C) Distribution of FOXP3-binding sites among direct targets of FOXP3 in relation to TSS. The activated genes are depicted in red, while the repressed genes are shown in green. (D) A known Fork Head DNA binding motif that was enriched among FOXP3-binding sites with a statistical significance (overrepresentation=2.17, Z-score=5.38, see Supplemental Table S3). (E) ChIP-qPCR of target genes of FOXP3 using MCF7 cells with and without FOXP3 induction. Means of triplicate qPCR reactions are shown and error bars represent +1SD. Y-axis represents % of input DNA. HPRT gene locus and 5′-upstream of HIG2 gene were used as negative controls. (F) mRNA levels of target genes of FOXP3. qRT-PCR was performed to examine mRNA expression levels of FOXP3’s target genes before and after FOXP3 induction. Error bars in E and F represent +1SD of triplicate qPCR. *: p<0.05 (t-test). (G) Functional categories of the direct target genes of FOXP3. Enrichments of functional categories among FOXP3’s direct target genes (listed in Supplemental Table S1 and S2) were calculated by Ingenuity Pathway Analysis software (http://www.ingenuity.com) and by comparing with those among randomly pooled human genes in the software. Y-axis represents –log(p-value)s and categories ranked within top-15 smallest p-values are listed. Red line: p=0.05. Numbers of genes in each category are indicated as inserts in the bars.
Fig. 2
Fig. 2. H4K16ac is induced by FOXP3-binding
(A) H4K16ac levels at FOXP3 binding sites were examined by ChIP-qPCR before and after FOXP3 induction in the FOXP3-tet-off MCF7 cell. Y-axis represents enrichments of the H4K16ac (% of input DNA). Error bars represent +1SD of triplicate qPCR. *: p<0.05 (t-test). n.s.: not significant. (B) A representative confocal image of FOXP3 (red) and H4K16ac (green) in the MCF7 cell transfected with FOXP3. White bars represent 5μm. Similar pattern was observed in 10/10 cells analyzed. (C) A representative signal intensity profile in the confocal image (Fig. 2B) is shown. Red, green and blue graphs indicate signal intensities of FOXP3, H4K16ac and DAPI, respectively.
Fig. 3
Fig. 3. FOXP3 interacts with MOF at the chromatin of FOXP3 target genes
(A) FLAG-MOF was expressed in FOXP3-tet-off MCF7 cells and ChIP-qPCR was performed using an anti-FLAG antibody. White and colored (red, green and black) bars represent [% of input DNA] before and after FOXP3 induction, respectively. Error bars represent +1SD of triplicate qPCR. *: p<0.05 (t-test). n.s.: not significant. Western blots of FOXP3 and MOF are shown as a right panel. DOX: doxycyline. (B) A representative confocal image of the MCF7 cell transfected with FOXP3 and MOF. FOXP3 (red) and MOF (green) were stained by an anti-FOXP3 and anti-MOF antibodies, respectively. Similar patterns were observed in all 10 cells analyzed. (C) A signal intensity profile of the FOXP3 and MOF in the MCF7 cell in Fig. 3B is shown. Red, green and blue graphs indicate signal intensities of FOXP3, MOF and DAPI, respectively. (D) Colocalization of MOF, H4K16ac and FOXP3 on chromatin as revealed by immunofluorescence after in situ subcellular fractionation. Controls are shown in Fig. S6. Signal intensity profile of the confocal image is shown as a bottom panel. Red, green and blue graphs indicate signal intensities of FOXP3, H4K16ac and DAPI, respectively. Similar patterns were observed in all 10 cells analyzed. (E) Co-IP targeting endogenous MOF and induced FOXP3 in the FOXP3-tet-off MCF7 cells. A co-IP was performed using an anti-MOF antibody. Precipitates were immunoblotted by an anti-FOXP3 antibody. Molecular weights are indicated to the left. (F) Upper Panel: FOXP3-myc/His and FLAG-MOF were expressed in 293T cells and co-IP with an anti-myc antibody was performed, and the precipitants were immunoblotted by an anti-FLAG antibody. IgG-H: heavy chains of IgG. Molecular weight is indicated at the left side. Lower Panels: Reciprocal co-IP with the anti-FLAG antibody was performed. Since the FOXP3-myc/His overlapped with IgG-H signals in a 10% SDS-PAGE gel, we used 6% SDS-PAGE gels in this experiment with a longer duration of electrophoresis. Immunoblots without primary myc-antibody was used to indicate the molecular sizes of IgG-H chains (lower panel). (G) Reciprocal co-IP was performed as in Fig. 3F with ethidium bromide (EtBr) or with DNase I treatment. EtBr: IP reactions were performed in an IP buffer containing EtBr (100μg/ml). DNase I: Before subjected to IP reaction, cell lysate was incubated with DNase I (10U/ml) for 30 minutes at room temperature. (H) FOXP3 lacking Forkhead domain (ΔC-FOXP3) and MOF were expressed in 293T cell and reciprocal co-IP was performed as in Fig. 3F. A diagram of ΔC-FOXP3 is shown in the upper panel. (I) A representative confocal image of U2OS sarcoma cells. Endogenous FOXP3 (green) and endogenous MOF (red) were stained by an anti-FOXP3 and anti-MOF antibodies, respectively. White bars indicate 10μm. Similar patterns were observed in at least 5 cells analyzed. (J) Endogenous interaction between Foxp3 and Mof in CD25-positive mouse T cell population as revealed by co-IP using anti-Foxp3 and anti-Mof antibodies.
Fig. 4
Fig. 4. MOF plays an important role in the FOXP3-mediated gene activation and in the FOXP3-dependent cell growth repression
(A) RNAi-mediated knockdown of endogenous MOF was performed in the FOXP3-tet-off MCF7 cells together with FOXP3 induction. Protein expression levels of MOF and FOXP3 were examined by western blots with anti-MOF and anti-FOXP3 antibodies. (B–C) Global mRNA expression analysis of direct target genes of FOXP3 with and without MOF knockdown. RNAi #2 was used in this analysis as the knockdown is more efficient. B: The heat map represents ratios of mRNA expressions before and after FOXP3 induction in control-RNAi and MOF-RNAi treated MCF7 cells (expression values in cells without FOXP3 induction were normalized to 1.0). Color scale of the heat map is indicated at the bottom of the Fig.. C: Bar graph represents log-scaled ratio of the relative mRNA expression between control-RNAi and MOF-RNAi groups. Dashed lines (red and green) represent log (ratio) = +0.5 (ratio=1.41) and = −0.5 (ratio=0.71). The “direct target genes” were defined as (1) direct binding of FOXP3 between −2 kbp and +2 kbp from TSS of genes revealed by ChIP-seq, and (2) mRNA expression values were increased to more than 1.5 times or decreased to less than 2/3 after FOXP3 induction in the control-RNAi treated MCF7 cells. Ctrl: control. (D) qRT-PCR was performed to examine mRNA levels of FOXP3’s target genes with and without MOF knock down. (E) 1.0×10⁵ FOXP3-tet-off MCF7 cells were plated into 6-well plates and treated with either control- or MOF-RNAi. After 6 days of FOXP3 induction, cell numbers were counted. Microscopic pictures of the cells on the 6th day are shown as a lower panel. White bars represent 20μm. (F) Cell growth repression rates (comparisons of cell numbers between FOXP3(−) and FOXP3(+) cells) in control- and MOF-RNAi treated groups were calculated from the data of Fig. 4e. Error bars in E–F represent +1SD. P-values were calculated by t-test. *: p<0.05, **: p<0.005, ***: p<0.0005. n.s.: not significant.
Fig. 5
Fig. 5. FOXP3 mutations abrogate the proper formation and function of FOXP3/MOF complex
(A) A schematic view of the FOXP3-mutants used in this study. ZF, LZ and FKHD represent zinc finger, leucine zipper and forkhead domains, respectively. a.a.: amino acid positions. A red and a blue dashed line represent deleted regions in ΔZF- and ΔLZ-FOXP3, respectively. P202L and V239I were found in human breast cancers and G203R was found in human prostate cancer. GST-fusion proteins used in this study are also indicated at the bottom. (B–C) Representative confocal images. Deletion (B) and somatic mutation (C) series of FOXP3-myc/His together with FLAG-MOF were expressed in MCF7 cells, and cells were stained using anti-myc, -FLAG and -acetyl-H4K16 antibodies as indicated. MCF7 cells transfected only with FLAG-MOF are also shown. White bars represent scales of the objects. Similar patterns were observed in all 5 cells analyzed. (D) Full length (FL) or deletion mutant FOXP3s were transfected into MCF7 cells. After 1 week of drug selection, ChIP-qPCR was performed using an anti-acetyl-H4K16 antibody. Enrichments of H4K16ac in the vector control cell were normalized to 1.0. (E) MCF7 cells were transfected with either vector, full-length FOXP3 or deletion/mutant-FOXP3 as indicated. After 2 weeks of blasticidin selection, cells were visualized by crystal violet dye and colony numbers were counted. (F) MCF7 cells were transfected with either vector, WT-FOXP3 or mutant-FOXP3 as indicated. After 1 week of drug selection, RT-PCRs were performed. Y-axis represents % of GAPDH expression. Error bars in D-F represent +1SD. P-values were calculated by t-test. *: p<0.05. (G) GST-pull down assay was performed using GST-FOXP3-domains and His-MOF proteins as indicated. (H) Left panel: Beads conjugated with either GST, LZ-GST or mutLZ(V239I)-GST were incubated with FLAG-MOF transfected 293T cell lysate. Precipitates were subjected to an immunoblot using anti-FLAG antibody. Right panel: GST pull down assay using LZ-GST conjugated beads was performed incubating with and without a blocking peptide corresponding to amino acids 232–246 of FOXP3 (CLLQREMVQSLEQQL). (I) Immunohistochemical staining using an anti-Mof antibody was performed using mouse prostate tissues with and without prostate-specific knockout of Foxp3 (16 weeks old Foxp3fl/y;PB-Cre+ and Foxp3wt/y;PB-Cre+ mice, respectively). Mof staining with a blocking peptide is shown as a negative control. Foxp3 staining is shown in the inserts. Black bars represent 50μm.
Fig. 6
Fig. 6. H3K4me3 is also associated with the FOXP3-mediated gene activation
(A) H3K4me3 levels at FOXP3 binding sites were examined by ChIP-qPCR before and after FOXP3 induction in the MCF7 cell. Error bars represent +1SD of triplicate qPCR. *: p<0.05 (t-test). n.s.: not significant. (B) A representative confocal image of FOXP3 (red) and H3K4me3 (green) in the MCF7 cell transfected with FOXP3. White bars represent 5μm. Signal intensity profile of the confocal image is shown as a bottom panel. Red, green and blue graphs indicate signal intensities of FOXP3, H3K4me3 and DAPI, respectively. Similar pattern was observed in 10/10 cells analyzed. (C) ChIP-qPCRs targeting endogenous MLL1, endogenous RbBP5 and exogenously expressed FLAG-WDR5 were performed using anti-MLL1, anti-RbBP5 and anti-FLAG antibodies, respectively. White and colored (red, green and black) bars represent [% of input DNA] before and after FOXP3 induction, respectively. GAPDH or 5′HIG2 were used as negative controls. Error bars represent +1SD of triplicate qPCR. n.s.: not significant (p>0.05, t-test).
Fig. 7
Fig. 7. FOXP3 facilitates H3K4me3 presumably by replacing histone demethylase(s) from its binding sites: a hypothetical model
(A) Transcription factor binding motifs which were significantly enriched among FOXP3-binding sites at either activated or repressed gene promoters are listed. TOP-10 ranked motifs as sorted by overrepresentation scores were included. Statistical significances were evaluated by Z-score according to the database www.genomatix.de. (B) A known DNA binding motif of PLU-1. (C) Genomic regions around the FOXP3-ChIP-seq peaks were partitioned into 150 bp windows, and enrichments of the Fork Head (FOXP3) and PLU-1 motifs among each of these 150 bp partitions are evaluated by the overrepresentation scores as in Fig. 7A. The YY1 motif was used as an unrelated negative control. *: Fork Head motifs were not identified in these regions. (D) ChIP-qPCR was performed using an anti-PLU-1 antibody targeting endogenous PLU-1 before and after FOXP3 induction. Y-axis represents qPCR signals (% of input DNA). Error bars represent +1SD of triplicate qPCR. *: p<0.05 (t-test). n.s.: not significant. (*1) P-value was calculated by chi-square test. With Yates modification: p = 0.0058. Fisher exact test: p = 0.0024. (E) A proposed model by which FOXP3 activates multiple gene expression by pulling MOF and causing displacement of H3K4me demethylase(s).

References

    1. Bennett CL, Christie J, Ramsdell F, Brunkow ME, Ferguson PJ, Whitesell L, Kelly TE, Saulsbury FT, Chance PF, Ochs HD. The immune dysregulation, polyendocrinopathy, enteropathy, X-linked syndrome (IPEX) is caused by mutations of FOXP3. Nat Genet. 2001;27:20–21. - PubMed
    1. Birzele F, Fauti T, Stahl H, Lenter MC, Simon E, Knebel D, Weith A, Hildebrandt T, Mennerich D. Next-generation insights into regulatory T cells: expression profiling and FoxP3 occupancy in Human. Nucleic acids research 2011 - PMC - PubMed
    1. Brunkow ME, Jeffery EW, Hjerrild KA, Paeper B, Clark LB, Yasayko SA, Wilkinson JE, Galas D, Ziegler SF, Ramsdell F. Disruption of a new forkhead/winged-helix protein, scurfin, results in the fatal lymphoproliferative disorder of the scurfy mouse. Nat Genet. 2001;27:68–73. - PubMed
    1. Cartharius K, Frech K, Grote K, Klocke B, Haltmeier M, Klingenhoff A, Frisch M, Bayerlein M, Werner T. MatInspector and beyond: promoter analysis based on transcription factor binding sites. Bioinformatics (Oxford, England) 2005;21:2933–2942. - PubMed
    1. Chatila TA, Blaeser F, Ho N, Lederman HM, Voulgaropoulos C, Helms C, Bowcock AM. JM2, encoding a fork head-related protein, is mutated in X-linked autoimmunity-allergic disregulation syndrome. The Journal of clinical investigation. 2000;106:R75–81. - PMC - PubMed

Publication types

MeSH terms

LinkOut - more resources