

Shared and unique components of human population structure and genome-wide signals of positive selection in South Asia
- PMID: 22152676
- PMCID: PMC3234374
- DOI: 10.1016/j.ajhg.2011.11.010
Shared and unique components of human population structure and genome-wide signals of positive selection in South Asia
Erratum in
- Am J Hum Genet. 2012 Feb 10;90(2):378-9
Abstract
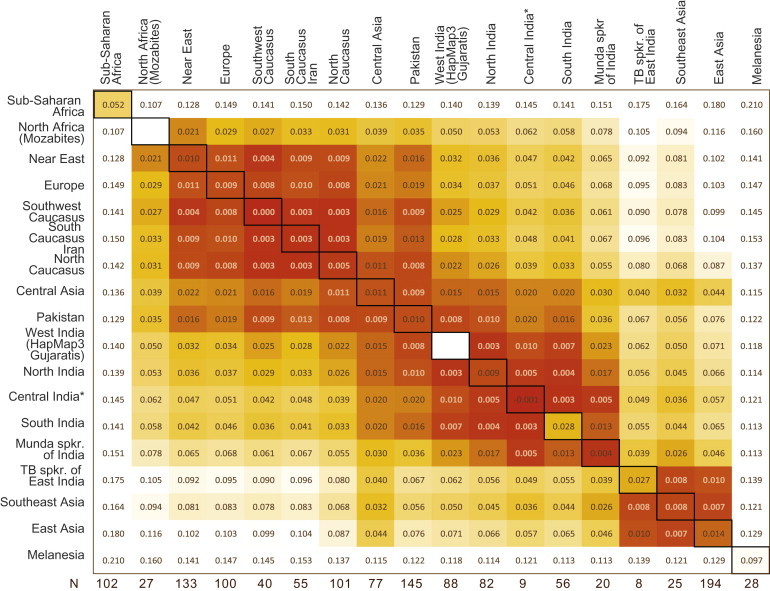
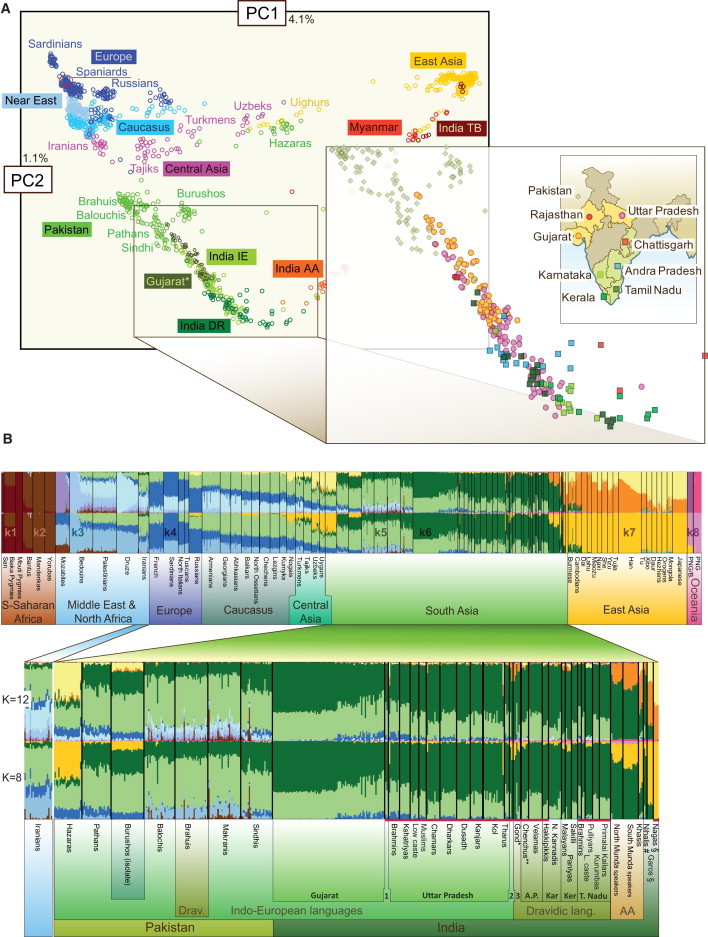
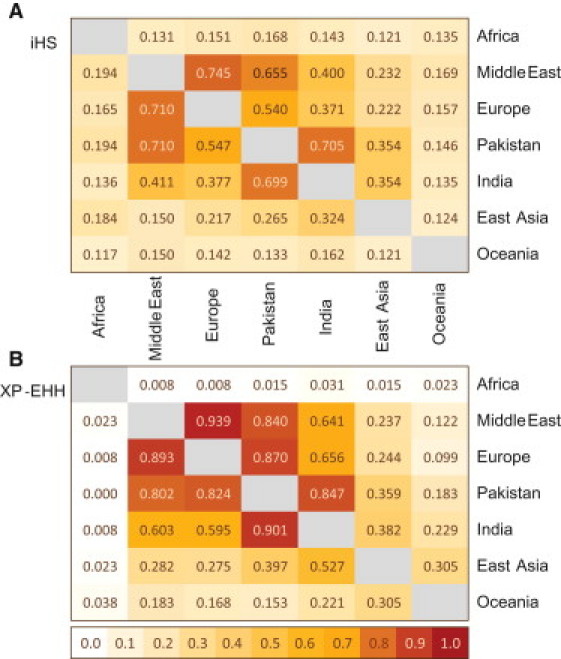
South Asia harbors one of the highest levels genetic diversity in Eurasia, which could be interpreted as a result of its long-term large effective population size and of admixture during its complex demographic history. In contrast to Pakistani populations, populations of Indian origin have been underrepresented in previous genomic scans of positive selection and population structure. Here we report data for more than 600,000 SNP markers genotyped in 142 samples from 30 ethnic groups in India. Combining our results with other available genome-wide data, we show that Indian populations are characterized by two major ancestry components, one of which is spread at comparable frequency and haplotype diversity in populations of South and West Asia and the Caucasus. The second component is more restricted to South Asia and accounts for more than 50% of the ancestry in Indian populations. Haplotype diversity associated with these South Asian ancestry components is significantly higher than that of the components dominating the West Eurasian ancestry palette. Modeling of the observed haplotype diversities suggests that both Indian ancestry components are older than the purported Indo-Aryan invasion 3,500 YBP. Consistent with the results of pairwise genetic distances among world regions, Indians share more ancestry signals with West than with East Eurasians. However, compared to Pakistani populations, a higher proportion of their genes show regionally specific signals of high haplotype homozygosity. Among such candidates of positive selection in India are MSTN and DOK5, both of which have potential implications in lipid metabolism and the etiology of type 2 diabetes.
Copyright © 2011 The American Society of Human Genetics. Published by Elsevier Inc. All rights reserved.
Figures
References
-
- Atkinson Q.D., Gray R.D., Drummond A.J. mtDNA variation predicts population size in humans and reveals a major Southern Asian chapter in human prehistory. Mol. Biol. Evol. 2008;25:468–474. - PubMed
-
- Kivisild T., Bamshad M.J., Kaldma K., Metspalu M., Metspalu E., Reidla M., Laos S., Parik J., Watkins W.S., Dixon M.E., et al. Deep common ancestry of indian and western-Eurasian mitochondrial DNA lineages. Curr. Biol. 1999;9:1331–1334. - PubMed
-
- Kivisild T., Kaldma K., Metspalu M., Parik J., Papiha S.S., Villems R. In: Genomic diversity. Papiha S.S., Deka R., Chakraborty R., editors. Kluwer Academic/Plenum Publishers; 1999. The place of the Indian mitochondrial DNA variants in the global network of maternal lineages and the peopling of the Old World; pp. 135–152.
-
- Metspalu M., Kivisild T., Metspalu E., Parik J., Hudjashov G., Kaldma K., Serk P., Karmin M., Behar D.M., Gilbert M.T., et al. Most of the extant mtDNA boundaries in south and southwest Asia were likely shaped during the initial settlement of Eurasia by anatomically modern humans. BMC Genet. 2004;5:26. - PMC - PubMed
Publication types
MeSH terms
LinkOut - more resources
Full Text Sources
Molecular Biology Databases
Research Materials
Miscellaneous
