. 2011 Dec 9;147(6):1233-47.
doi: 10.1016/j.cell.2011.10.043.

An HNF4α-miRNA inflammatory feedback circuit regulates hepatocellular oncogenesis

Affiliations

An HNF4α-miRNA inflammatory feedback circuit regulates hepatocellular oncogenesis

Maria Hatziapostolou et al. Cell. .

Erratum in

  • Cell. 2013 Feb 28;152(5):1196

Abstract

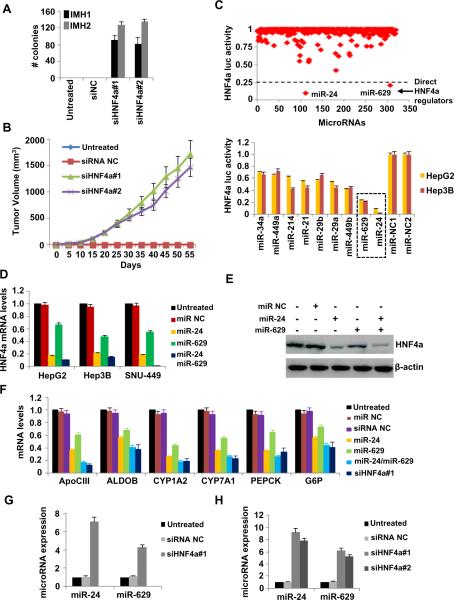
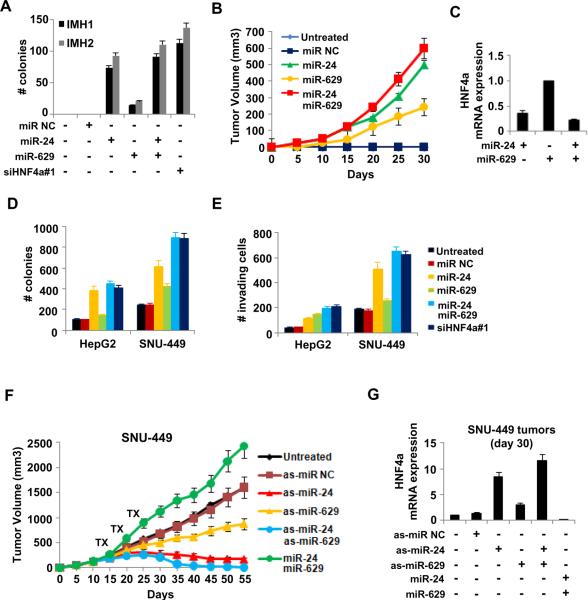
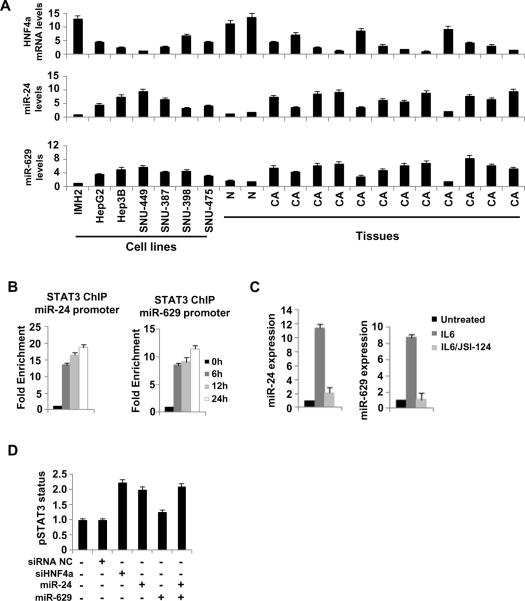
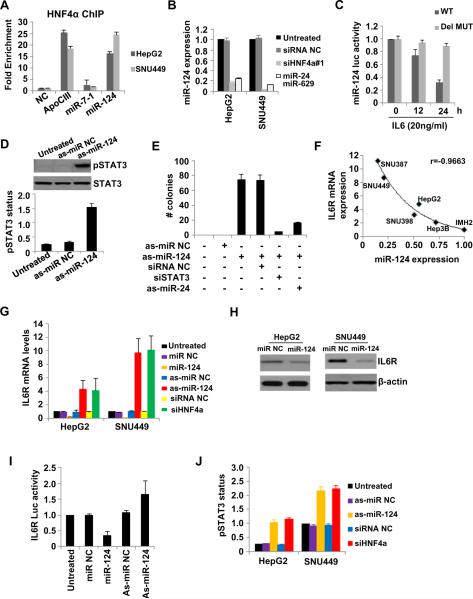
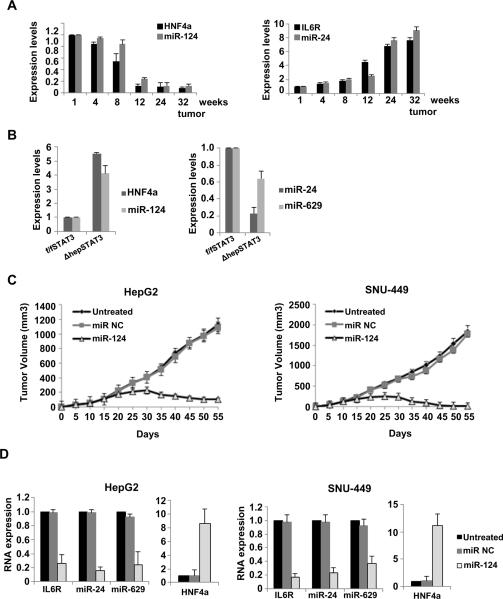
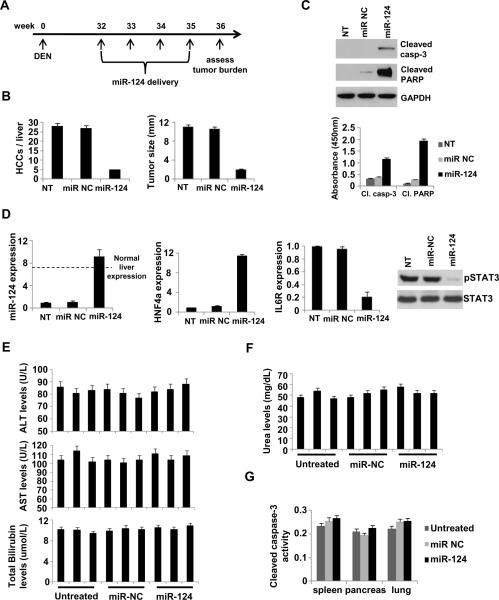
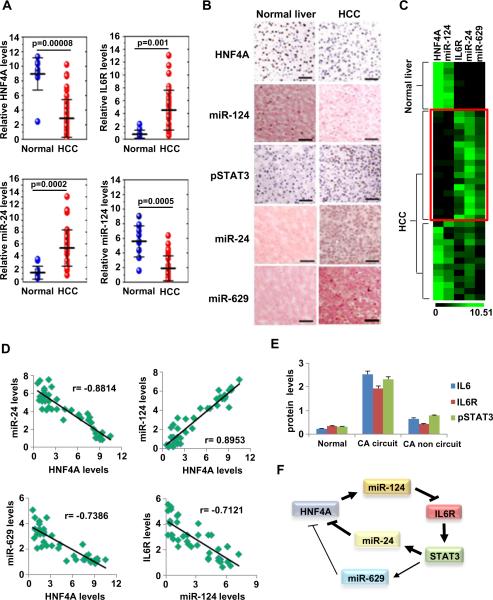
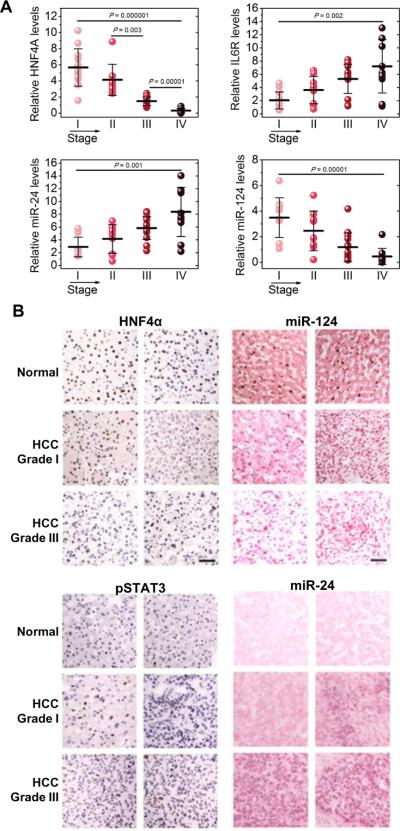
Hepatocyte nuclear factor 4α (HNF4α) is essential for liver development and hepatocyte function. Here, we show that transient inhibition of HNF4α initiates hepatocellular transformation through a microRNA-inflammatory feedback loop circuit consisting of miR-124, IL6R, STAT3, miR-24, and miR-629. Moreover, we show that, once this circuit is activated, it maintains suppression of HNF4α and sustains oncogenesis. Systemic administration of miR-124, which modulates inflammatory signaling, prevents and suppresses hepatocellular carcinogenesis by inducing tumor-specific apoptosis without toxic side effects. As we also show that this HNF4α circuit is perturbed in human hepatocellular carcinomas, our data raise the possibility that manipulation of this microRNA feedback-inflammatory loop has therapeutic potential for treating liver cancer.


Figures

Figure 1
Figure 1
HNF4α suppression through miR-24 and miR-629 induce hepatocellular transformation. (A) Soft-agar colony assay of non transformed immortalized hepatocytes (IMH1, IMH2) treated for 48h with siRNA negative control (siNC) or two different siRNAs against HNF4α (siHNF4α#1, siHNF4α#2). Colonies (mean ± SD) 50 μm were counted using a microscope 20 days later. (B) Tumor volume (mean ± SD) in mice injected with IMH1 cells untreated or treated for 48h with siRNA NC, siHNF4α#1 or siHNF4α#2. (C) Effects of microRNAs (primary screen) on HNF4α luciferase activity in HepG2 cells (top panel). The top 9 hits identified from the primary microRNA library screen, were tested in secondary screen in HepG2 and Hep3B cells (bottom panel). (D) HNF4α mRNA levels (mean ± SD of three independent experiments) assessed by real-time RT-PCR analysis in HepG2, Hep3B and SNU-449 cells untreated or treated with 100nM miR NC or miR-24 and/or miR-629 for 48h. (E) HNF4α protein levels in HepG2 cells untreated or treated with 100nM miR NC or miR-24 and/or miR-629 for 48h. (F) mRNA levels of HNF4α direct targets (mean ± SD of three independent experiments) assessed by real-time RT-PCR analysis in HepG2 cells untreated or treated with 100nM miR NC or miR-24 and/or miR-629 or siRNA NC or siRNA or siHNF4α#1 for 48h. (G) miR-24 and miR-629 expression levels (mean ± SD of three independent experiments) assessed by real-time RT-PCR analysis in IMH1 cells that were untreated or treated for 48h with siRNA NC or siHNF4α#1. (H) miR-24 and miR-629 expression levels (mean ± SD of three independent experiments) assessed by real-time RT-PCR analysis in tumors derived from injected IMH1 cells that were untreated or treated for 48h with siRNA NC or siHNF4α#1 or siHNF4α#2.
Figure 2
Figure 2
MiR-24 and miR-629 regulate the induction and stability of the hepatocellular transformed phenotype. (A) Number of colonies (>50 μm) (mean ± SD) of IMH1 and IMH2 cells treated with 100nM miR NC, miR-24 and/or miR-629 or siHNF4α#1 for 48h. (B) Tumor volume (mean ± SD) in mice injected with IMH1 cells untreated or treated for 48h with 100nM miR NC or miR-24 and/or miR-629. (C) HNF4α mRNA levels assessed by real-time RT-PCR analysis in tumors (day 30) derived from IMH1 cells untreated or treated for 48h with 100nM miR-24 and/or miR-629. (D) Soft-agar colony assay (mean ± SD) and (E) invasion assay (mean ± SD) of HepG2 and SNU-449 cells treated with 100nM miR NC, miR-24, miR-629 or siHNF4α#1 for 24h. (F) Tumor volume (mean ± SD) in mice injected with SNU-449 cells and treated with as-miR NC or as-miR-24 and/or as-miR-629, or miR-24 and miR-629. (G) HNF4α mRNA levels (mean ± SD) in tumors (day 30) derived from mice treated with as-miR NC or as-miR-24 and/or as-miR-629 or miR-24 and miR-629.
Figure 3
Figure 3
STAT3 regulates miR-24 and miR-629 during hepatocellular transformation. (A) HNF4α, miR-24 and miR-629 levels in non-transformed immortalized hepatocytes (IMH2), different HCC lines, 2 normal liver tissues (N) and 12 hepatocellular cancer tissues (CA). (B) STAT3 occupancy (fold enrichment) at the miR-24 and miR-629 loci as determined by chromatin immunoprecipitation of cross-linked SNU-449 cells treated with IL6 (20ng/ml) for 6, 12 or 24h. (C) miR-24 and miR-629 expression levels (mean ± SD) in SNU-449 cells treated with IL6 (10ng/ml) for 24h or JSI-124 (5μg/ml) for 24h and then IL6 for 24h. (D) STAT3 phosphorylation status (Tyr 705) assessed by ELISA in SNU-449 cells treated with 1nM siRNA NC, siHNF4α#1, miR-24 and/or miR-629 for 24h. The data are presented as mean ± SD of three independent experiments.
Figure 4
Figure 4
HNF4α binds and regulates miR-124 which controls directly IL6R expression in hepatocytes. (A) HNF4α occupancy (fold enrichment) in ApoCIII, miR-7-1 and miR-124 promoter areas. (B) miR-124 levels (mean ± SD) in HepG2 and SNU-449 treated with siRNA NC, siHNF4α#1, miR-24 and miR-629 for 24h. (C) Luciferase activity (mean ± SD) of a reporter construct harboring miR-124 promoter (wild type or deletion mutant in the HNF4α binding site) 12 and 24h post treatment with IL6 (10ng/ml) in HepG2 cells. (D) STAT3 phosphorylation status (Tyr 705) (mean ± SD) evaluated by ELISA and western blot analyses after treatment with as-miR-NC or as-miR-124 for 24h in HepG2 cells. (E) Number of colonies (mean ± SD) of non-transformed immortalized hepatocytes (IMH1) treated with as-miR NC or as-miR-124 together with siRNA NC or siRNA against STAT3 (siSTAT3) or as-miR-24 for 24h. The data are presented as mean ± SD of three independent experiments. (F) miR-124 and IL6R levels in the indicated cell lines and a correlation coefficient (r) is shown. (G) IL6R mRNA levels (mean ± SD) in HepG2 and SNU-449 cells treated for 24h with miR-NC, miR-124, as-miR NC, as-miR-124, siRNA NC, siHNF4α. (H) IL6R protein levels in HepG2 and SNU-449 cells treated for 24h with miR-NC or miR-124. (I) Luciferase assay using a reporter construct containing the 3'UTR of IL6R, 24h after transfection with miR-NC, miR-124, as-miR NC, as-miR-124. The data are presented as (mean ± SD). (J) STAT3 phosphorylation status (Tyr 705) evaluated by ELISA in HepG2 and SNU-449 cells treated for 24h with as-miR NC, as-miR-124, siRNA NC and siHNF4α. The data are presented as mean ± SD of three independent experiments.
Figure 5
Figure 5
The HNF4α circuit is perturbed during HCC development. (A) Assessment of HNF4α, miR-124, IL6R and miR-24 levels (mean ± SD) in purified hepatocytes during DEN-induced liver carcinogenesis in mice. (B) Evaluation of HNF4α mRNA levels and miR-124, miR-24 and miR-629 levels derived from DEN-treated male STAT3f/f and STAT3Δhep mice. The experiments have been performed in triplicate and data shown mean ± SD. (C) Tumor volume (mean ± SD) in mice injected with HepG2 and SNU-449 cells, treated with miR NC or miR-124. Treatments were repeated every five days and tumor volume was monitored every five days for 55 days. (D) IL6R, miR-24, miR-629 and HNF4α levels (mean ± SD) assessed by real-time RT-PCR analysis, in tumors (day 30) derived from mice treated with miR NC or miR-124.
Figure 6
Figure 6
Modulation of the HNF4α circuit prevents and suppresses HCC development in mice. (A) Timeline of miR-124 therapeutic delivery experiment. (B) Number of HCC tumors/liver and tumor size (mm3) in non-treated (NT), miR-NC and miR-124 treated mice (week 36). (C) Levels of cleaved PARP and caspase-3 in untreated, miR NC and miR-124 treated mice (week 36) assessed by ELISA and western blot analyses. (D) Evaluation of miR-124 levels, HNF4α levels, IL6R levels by real-time PCR and STAT3 phosphorylation status (Tyr705) by western blot, in tumors derived from non-treated (NT), miR-NC and miR-124 treated mice (week 36). The data are shown as mean ± SD. (E) Levels of alanine aminotransferase (ALT), aspartate aminotransferase (AST), total bilirubin and (F) of urea were assessed in the serum of mice treated with 10mg/kg miR-NC or miR-124 for 48h. Each bar represents a different mouse. The experiment was performed in triplicate and the data show mean ± SD. (G) Cleaved Caspase-3 activity (mean ± SD) assessed by ELISA assays in tissues (spleen, pancreas, heart) derived from untreated, miR-NC or miR-124 treated mice.
Figure 7
Figure 7
HNF4α circuit is perturbed in human hepatocellular carcinomas. (A) Assessment of HNF4α, IL6R, miR-24 and miR-124 levels (mean ± SD) by real-time PCR analysis in total RNAs derived from 12 normal liver tissues and 45 hepatocellular carcinomas. (B) Immunohistochemistry for HNF4α, pSTAT3 and in situ hybridization for miR-124 and miR-24 in FFPE sections of hepatocellular carcinomas and normal liver tissues. Sections were subjected to immunohistochemistry for HNF4α (DAB staining, brown color) and phospho-STAT3 (Tyr705) (DAB staining) and counterstained with haematoxylin (blue color) and in situ hybridization for miR-124, miR-24, and miR-629 and counterstained with nuclear fast red. Bar, 100 μm. (C) Heatmap representation of HNF4α, IL6R, miR-24 and miR-124 levels assessed by real-time PCR (mean ± SD) in tissue-microdissected FFPE sections of 8 normal liver tissues and 31 hepatocellular carcinomas. (D) Correlation between the expression levels of different members of the HNF4α circuit (same samples as in figure 7C). Each data point represents an individual liver tissue sample and a correlation coefficient (r) is shown. (E) Levels of IL6, IL6R and pSTAT3 (Tyr705) assessed by ELISA, in 8 normal liver tissues, 31 hepatocellular carcinomas [18 tissues with activation of the HNF4α circuit (CA circuit) and 13 liver cancer tissues without activation of the HNF4α circuit (CA non circuit)]. The data are presented as mean ± SD of three independent experiments. (F) Schematic representation of the proposed HNF4α feedback circuit in hepatocellular oncogenesis.
Figure 8
Figure 8
HNF4α circuit is perturbed during HCC progression. (A) Assessment of HNF4α, IL6R, miR-24 and miR-124 levels in total RNAs derived from 45 hepatocellular carcinomas, according to their tumor stage. The experiments have been performed in triplicate and data are shown as mean ± SD. (B) HCC sections were subjected to immunohistochemistry for HNF4α and phospho-STAT3 (Tyr705) (DAB staining, brown) and counterstained with haematoxylin (blue) and in situ hybridization for miR-124 and miR-24 and counterstained with nuclear fast red. Representative pictures are shown from normal, HCC grade I and HCC grade III tissues. Bar, 50μm.

Comment in

Similar articles

Cited by

References

    1. Ahn SH, Shah YM, Inoue J, Morimura K, Kim I, Yim S, Lambert G, Kurotani R, Nagashima K, Gonzalez FJ, et al. Hepatocyte nuclear factor 4alpha in the intestinal epithelial cells protects against inflammatory bowel disease. Inflamm Bowel Dis. 2008;14:908–920. - PMC - PubMed
    1. Barrett JC, Lee JC, Lees CW, Prescott NJ, Anderson CA, Phillips A, Wesley E, Parnell K, Zhang H, Drummond H, et al. Genome-wide association study of ulcerative colitis identifies three new susceptibility loci, including the HNF4A region. Nat Genet. 2009;41:1330–1334. - PMC - PubMed
    1. Bromberg JF, Wrzeszczynska MH, Devgan G, Zhao Y, Pestell RG, Albanese C, Darnell JE., Jr. Stat3 as an oncogene. Cell. 1999;98:295–303. - PubMed
    1. Calvisi DF, Ladu S, Gorden A, Farina M, Conner EA, Lee JS, Factor VM, Thorgeirsson SS. Ubiquitous activation of Ras and Jak/Stat pathways in human HCC. Gastroenterology. 2006;130:1117–1128. - PubMed
    1. Cattin AL, Le Beyec J, Barreau F, Saint-Just S, Houllier A, Gonzalez FJ, Robine S, Pincon-Raymond M, Cardot P, Lacasa M, et al. Hepatocyte nuclear factor 4alpha, a key factor for homeostasis, cell architecture, and barrier function of the adult intestinal epithelium. Mol Cell Biol. 2009;29:6294–6308. - PMC - PubMed

Publication types