. 2011 Dec 9;147(6):1270-82.
doi: 10.1016/j.cell.2011.10.053.

Cofactor binding evokes latent differences in DNA binding specificity between Hox proteins

Affiliations

Cofactor binding evokes latent differences in DNA binding specificity between Hox proteins

Matthew Slattery et al. Cell. .

Abstract

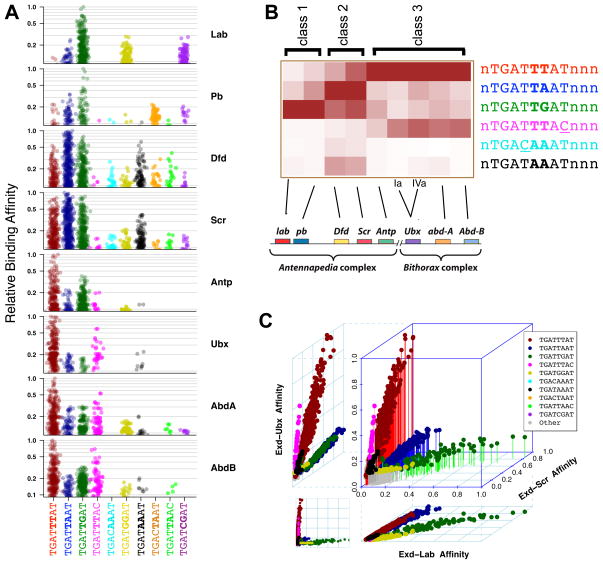
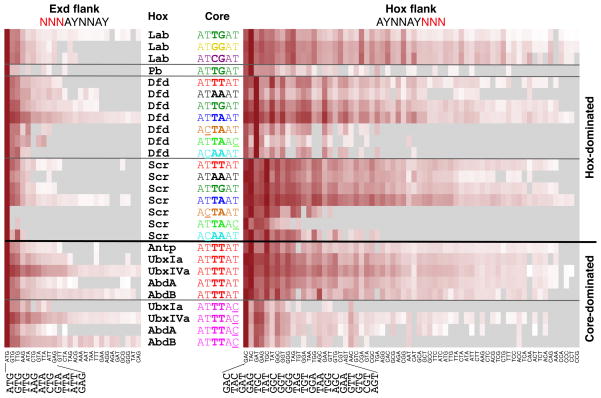
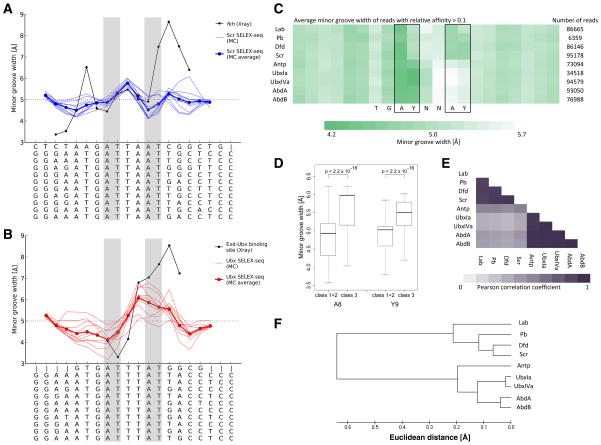
Members of transcription factor families typically have similar DNA binding specificities yet execute unique functions in vivo. Transcription factors often bind DNA as multiprotein complexes, raising the possibility that complex formation might modify their DNA binding specificities. To test this hypothesis, we developed an experimental and computational platform, SELEX-seq, that can be used to determine the relative affinities to any DNA sequence for any transcription factor complex. Applying this method to all eight Drosophila Hox proteins, we show that they obtain novel recognition properties when they bind DNA with the dimeric cofactor Extradenticle-Homothorax (Exd). Exd-Hox specificities group into three main classes that obey Hox gene collinearity rules and DNA structure predictions suggest that anterior and posterior Hox proteins prefer DNA sequences with distinct minor groove topographies. Together, these data suggest that emergent DNA recognition properties revealed by interactions with cofactors contribute to transcription factor specificities in vivo.


Figures

Figure 1
Figure 1. Overview of SELEX-seq
The starting point is a pool of synthesized DNA oligonucleotides containing a region of 16 random base pairs. This random pool is made double stranded and then sequenced using Illumina sequencing, resulting in a set of R0 reads. EMSAs are performed on the random pool and DNA molecules bound to Exd-Hox heterodimers are isolated and amplified by PCR. This enriched pool (R1) is sequenced. The affinity-based selection step is repeated multiple times. To accurately parameterize the sequence biases in R0, a Markov model is constructed. Relative fold-enrichments associated with the affinity-based selection step are calculated for all 12-mers. Information from earlier and later rounds of selection is combined using LOESS regression to estimate the relative binding affinity for each 12-mer with an optimal trade-off between accuracy and precision. See also Figure S1 and Tables S1, S2.
Figure 2
Figure 2. Multiple core sequences support DNA recognition by Exd-Hox dimers
(A) Information gain (Kullback-Leibler divergence) associated with two rounds of affinity-based selection as a function of oligonucleotide length. (B) Direct comparison between 12-mer affinities estimated as relative R0⇒R1 enrichments and R0⇒R2 enrichments corrected for nonlinear bias using LOESS regression. The error bars denote the standard error in the estimate of the relative affinity as calculated based on Poisson statistics (see Supplemental Experimental Procedures). (C) Systematic discovery of Exd-Hox core binding motifs based on iterative selection of core motifs that are the most enriched after one round of selection. The most enriched sequences for any Exd-Hox contain one of the three primary motifs TGATTDAT (red, blue, green). Secondary motifs supporting a relative binding affinity of at least 25% all fit the consensus WRAYNNAY. The underlined base pairs indicate where Asn51 of the Exd and Hox homeodomains contacts the DNA, respectively. The IUPAC symbols “W” denotes A or T, “R” denotes A or G, “Y” denotes C or T, and “D” denotes not C. (D) Scatter plot showing a direct comparison of the DNA binding preferences of Exd-Dfd and Exd-AbdA. Each point in the plot represents a unique 12-mer and is color-coded according to the core hexamer it contains; all possible 12-mers for which relative affinities could be determined are plotted. The error bars denote the standard error in the estimate of the relative affinity as calculated based on Poisson statistics (see Supplemental Experimental Procedures). The multiple diagonals with distinct slopes (arrows) indicate different relative preferences for the two dimers. The identities of the flanks modulate the binding affinity (distance from the origin). See also Figure S2 and Table S3.
Figure 3
Figure 3. Exd-Hox heterodimers can be distinguished based on their DNA specificity fingerprints
(A) Strip charts (with arbitrary horizontal displacement) showing the distribution of relative affinities across all 12-mers for each Exd-Hox dimer. (B) Heat map of the Exd-Hox dimers based on the maximum relative affinity in each core motif class defines three major specificity classes, 1 to 3. The clustering is consistent with the linear ordering of the Hox genes along the chromosome. (C) Three-dimensional scatter plot comparing representative Exd-Hox complexes from each major specificity class. Two-dimensional projections for each pair-wise comparison are shown. Color-coding is according to Figure 2C. See also Figure S3 and Table S4.
Figure 4
Figure 4. Heterodimerization with Exd elicits novel binding specificities
(A–C) Comparative specificity plots for monomeric Hox proteins showing relative affinities for all 9-mers. Comparing Scr vs Ubx (A) and Scr vs Lab (B) shows that there are only small differences in binding preference. Comparing Ubx vs AbdB (C) reveals that these two Hox proteins have both shared (e.g. light green) and distinct (e.g. orange for Ubx and magenta for AbdB) binding preferences. The error bars denote the standard error in the estimate of the relative affinity as calculated based on Poisson statistics (see Supplemental Experimental Procedures). (D–F) Comparative specificity plots for Exd-Hox dimers showing relative affinities for all 12-mers. Comparing Exd-Scr vs Exd-Ubx (D) and Exd-Scr vs Exd-Lab (E) reveals differences in binding preference not observed for the corresponding monomer comparisons. Exd-Ubx vs Exd-AbdB (F) reveals a convergence of binding preference for red and magenta binding sites. The error bars denote the standard error in the estimate of the relative affinity as calculated based on Poisson statistics (see Supplemental Experimental Procedures). See also Figure S3.
Figure 5
Figure 5. Modulation of affinity and specificity by the Exd and Hox flanks
The relative affinities of all possible trinucleotides for both the Exd flank (left) and Hox flank (right) were analyzed in terms of their sequence context (Hox protein identity and core motif color). The number of trinucleotides displayed for the Exd flank was truncated because of the nearly complete absence of any binding for the less-preferred sequences. Preferences for the Hox flank depend on both the identity of the Hox protein (above the black line) and of the core motif (below the black line). Hox flank preference is dominated by Hox identity for class 1 and 2 Hox proteins, while it is dominated by core motif identity for class 3 Hox proteins. Gray positions denote sequences with <100 counts (leading to relative errors greater than 10%), and have affinities less than the lightest colored cell for a given row.
Figure 6
Figure 6. Predicted minor groove widths of Exd-Hox binding sites
(A, B) MC predictions of minor groove width of selected binding sites for Exd-Scr (A) and Exd-Ubx (B). Groove widths of the DNA from crystal structures (black) of Exd-Hox-DNA ternary complexes (Joshi et al., 2007; Passner et al., 1999) are plotted with the widths predicted for the ten highest affinity binding sites (thin blue lines in (A) and thin red lines in (B)) and their average groove widths (thick blue line in (A) and thick red line in (B)). Sequences from crystal structures (top) and the ten SELEX-seq sites are below the x-axis; gray shading highlights A4T5 and A8T9. (C) Heat map characterizing the average minor groove width of all sequences above a relative binding affinity threshold of 0.1 for each Exd-Hox heterodimer. Dark green represents narrow minor groove regions and white denotes wider minor grooves. (D) Minor groove width values at the most distinct A8 and Y9 positions are compared in box plots for the data shown in panel (C) and Mann-Whitney U p-values between the two groups, class 1+2 and class 3 Hox binding sites, indicate significant differences. (E) Average minor groove width is compared in all positions of the nTGAYNNAYnnn dodecamer for the different Exd-Hox sites using Pearson correlation. Dark purple represents high similarity while white characterizes low similarity. (F) Dendrogram comparing minor groove shape for Exd-Hox binding sites based on Euclidean distances between average minor groove width in the six positions of the AYNNAY core. See also Figures S4, S6.
Figure 7
Figure 7. Relative affinities defined by SELEX-seq match those measured in vitro and correlate with binding in vivo
(A) Plot comparing the ratio of Kds defined by EMSA (Y axis) with the ratio of relative affinities defined by SELEX-seq (X axis). Error bars on the Y-axis were computed using linearization and are based on the standard error of the mean over replicates for individual binding constants; those on the X-axis are based on the standard error in the estimated relative affinity (see Supp. Experimental Procedures). The circles represent the blue/red affinity ratios for AbdB, UbxIa, UbxIVa, Antp, AbdA, Scr, and Dfd. The triangle shows the yellow/green affinity ratio for Lab (adjusted R2 = 0.88). (B) Bar graphs showing the total in vitro binding affinity for Exd-Ubx (as predicted using 12-mer relative affinities derived from SELEX-seq) in genomic windows occupied in vivo by Ubx, Hth, or both (as determined using ChIP-chip), as a fold-enrichment relative to a set of control regions of the same size. Results are shown for ChIP data combined from the T3 leg and haltere. The symbols above each bar denote the statistical significance level (*** p < 0.001, * p < 0.05). Error bars correspond to standard errors, computed based on a thousand samples from the control distribution. (C) Same as (B), but separated by core motif color and tissue (haltere on the left, T3 leg on the right). See also Figure S5.

Comment in

References

    1. Abu-Shaar M, Ryoo HD, Mann RS. Control of the nuclear localization of Extradenticle by competing nuclear import and export signals. Genes Dev. 1999;13:935–945. - PMC - PubMed
    1. Alexander T, Nolte C, Krumlauf R. Hox genes and segmentation of the hindbrain and axial skeleton. Annu Rev Cell Dev Biol. 2009;25:431–456. - PubMed
    1. Bartfeld D, Shimon L, Couture GC, Rabinovich D, Frolow F, Levanon D, Groner Y, Shakked Z. DNA recognition by the RUNX1 transcription factor is mediated by an allosteric transition in the RUNT domain and by DNA bending. Structure. 2002;10:1395–1407. - PubMed
    1. Berger MF, Badis G, Gehrke AR, Talukder S, Philippakis AA, Pena-Castillo L, Alleyne TM, Mnaimneh S, Botvinnik OB, Chan ET, et al. Variation in homeodomain DNA binding revealed by high-resolution analysis of sequence preferences. Cell. 2008;133:1266–1276. - PMC - PubMed
    1. Cao Y, Yao Z, Sarkar D, Lawrence M, Sanchez GJ, Parker MH, MacQuarrie KL, Davison J, Morgan MT, Ruzzo WL, et al. Genome-wide MyoD binding in skeletal muscle cells: a potential for broad cellular reprogramming. Dev Cell. 2010;18:662–674. - PMC - PubMed

Publication types