. 2011 Dec 9;147(6):1309-23.
doi: 10.1016/j.cell.2011.11.020.

The STARD9/Kif16a kinesin associates with mitotic microtubules and regulates spindle pole assembly

Affiliations

The STARD9/Kif16a kinesin associates with mitotic microtubules and regulates spindle pole assembly

Jorge Z Torres et al. Cell. .

Abstract

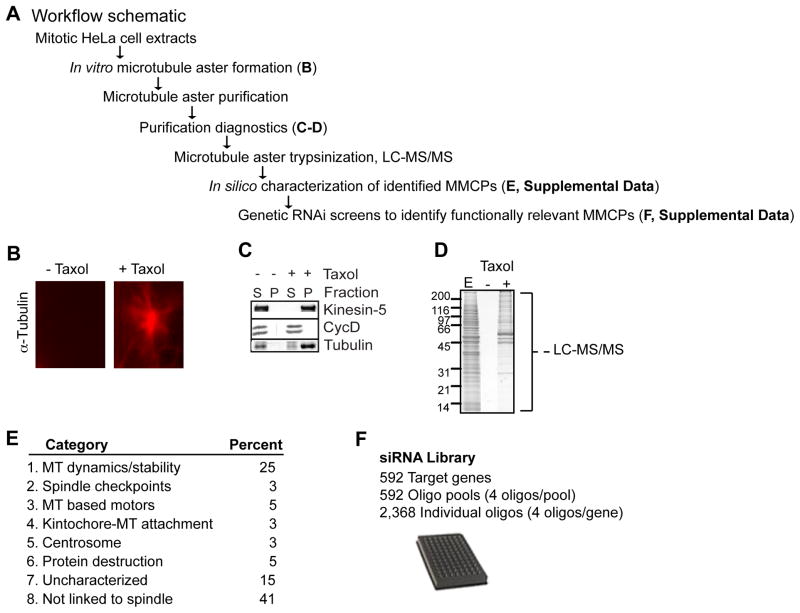
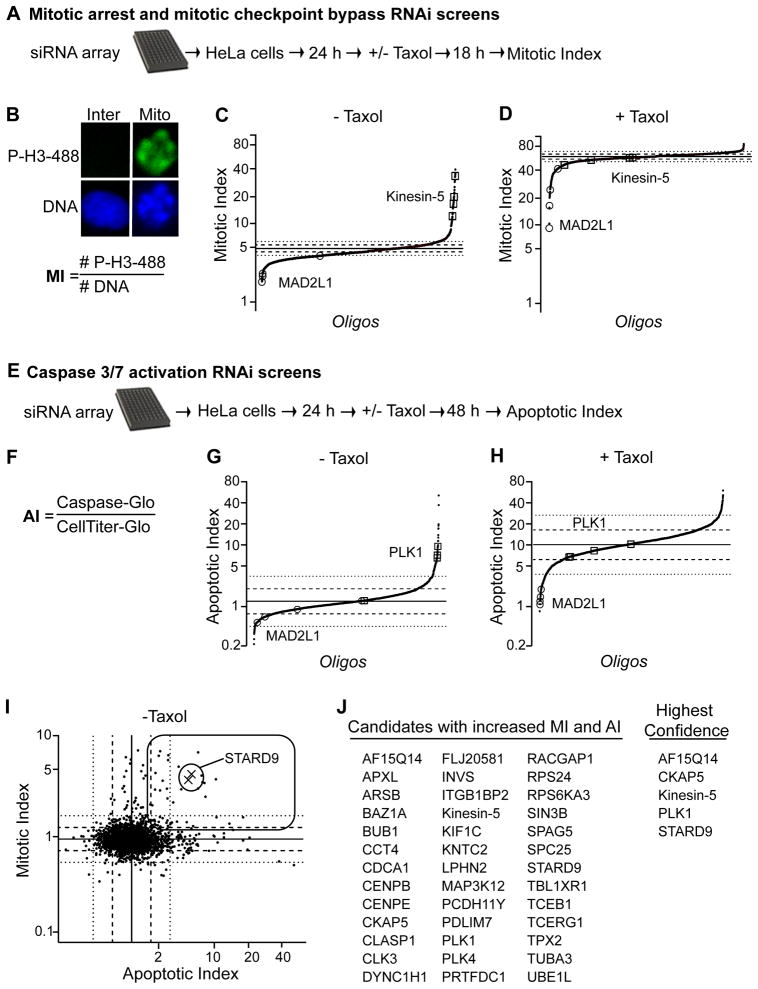
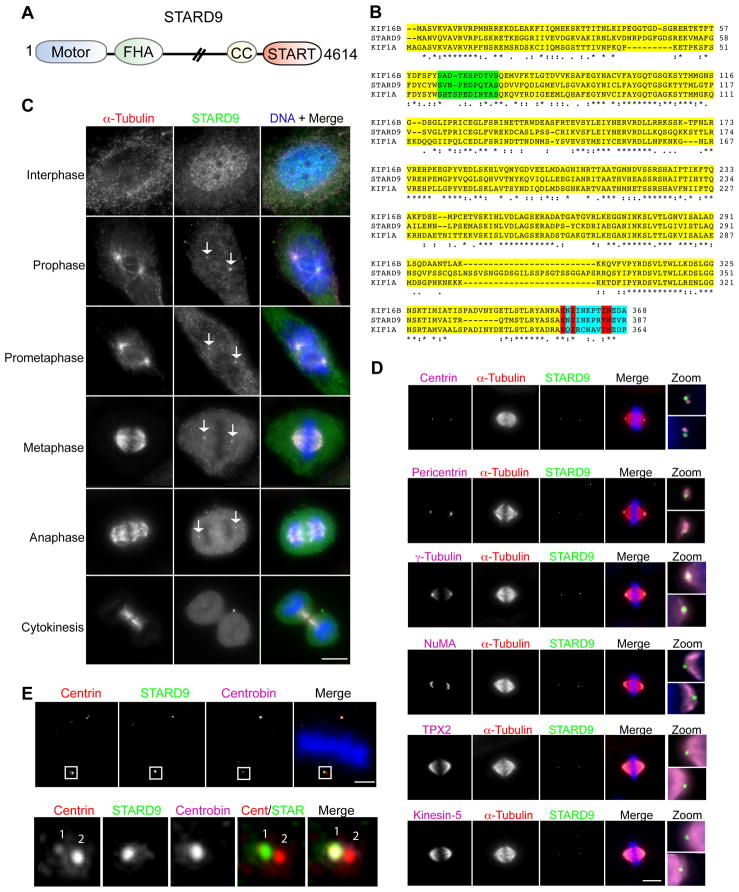
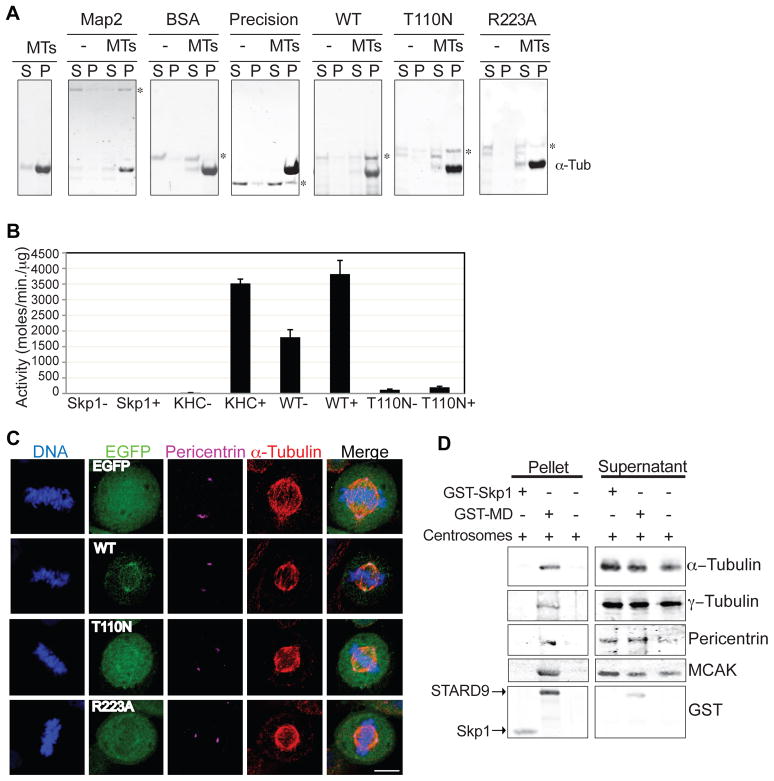
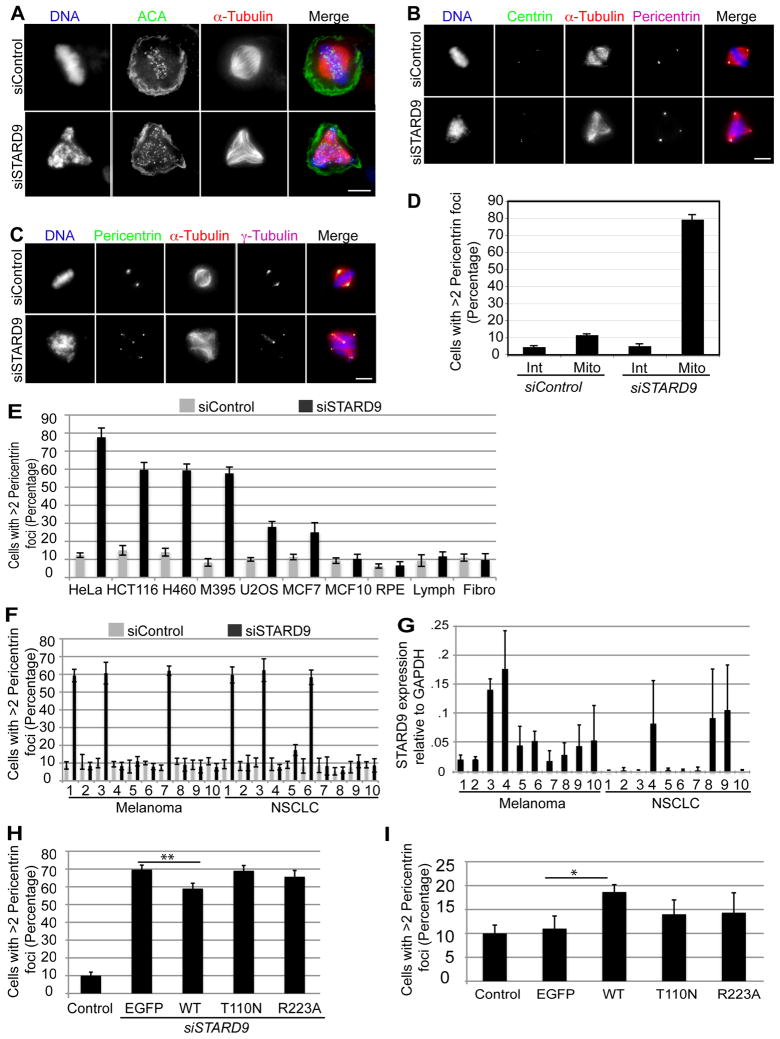
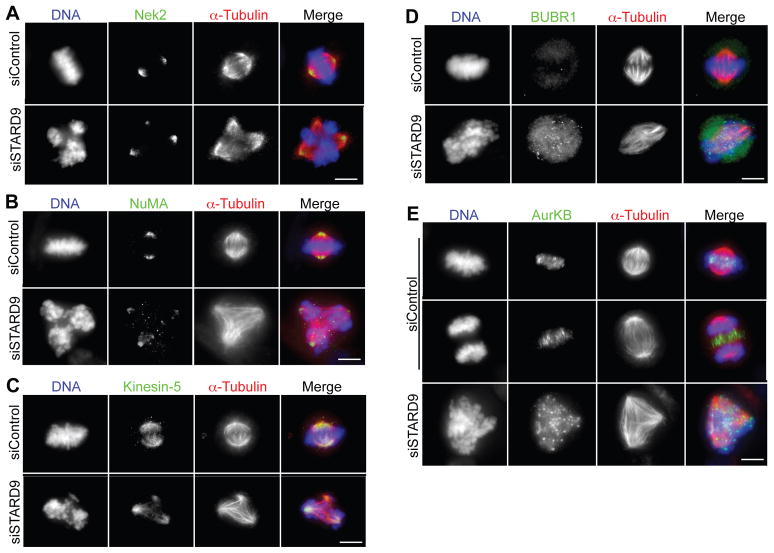
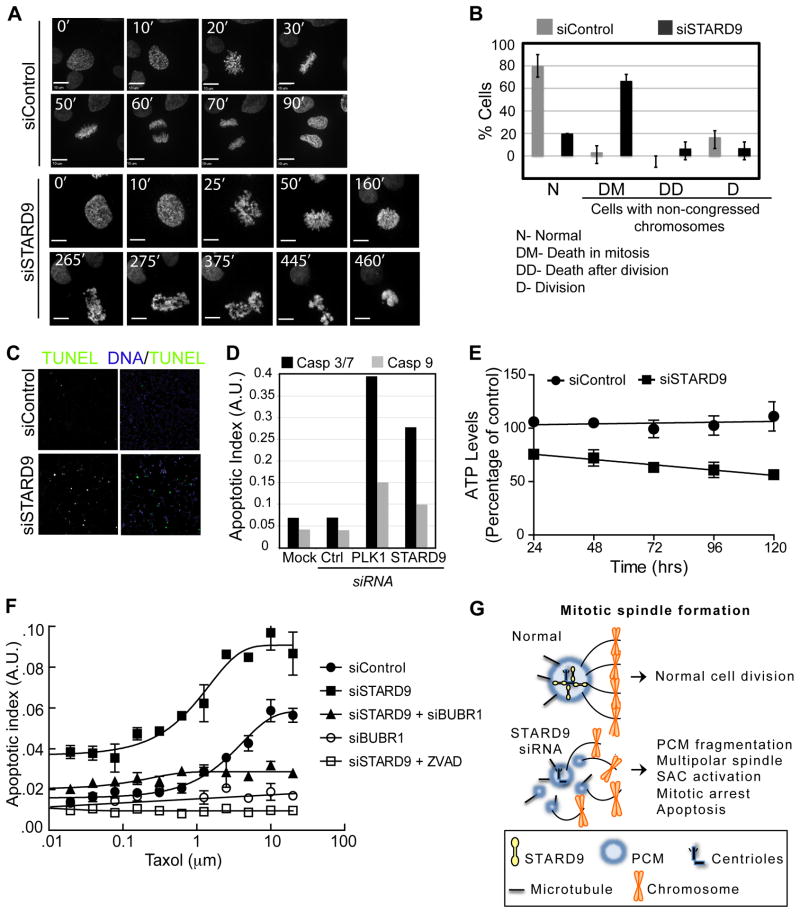
During cell division, cells form the microtubule-based mitotic spindle, a highly specialized and dynamic structure that mediates proper chromosome transmission to daughter cells. Cancer cells can show perturbed mitotic spindles and an approach in cancer treatment has been to trigger cell killing by targeting microtubule dynamics or spindle assembly. To identify and characterize proteins necessary for spindle assembly, and potential antimitotic targets, we performed a proteomic and genetic analysis of 592 mitotic microtubule copurifying proteins (MMCPs). Screening for regulators that affect both mitosis and apoptosis, we report the identification and characterization of STARD9, a kinesin-3 family member, which localizes to centrosomes and stabilizes the pericentriolar material (PCM). STARD9-depleted cells have fragmented PCM, form multipolar spindles, activate the spindle assembly checkpoint (SAC), arrest in mitosis, and undergo apoptosis. Interestingly, STARD9-depletion synergizes with the chemotherapeutic agent taxol to increase mitotic death, demonstrating that STARD9 is a mitotic kinesin and a potential antimitotic target.


Figures

Figure 1
Figure 1. Proteomic and In Silico Analysis of MMCPs
(A) Workflow for purification and identification of MMCPs. (B) In vitro mitotic aster microtubule polymerization reactions ± taxol, visualized with anti α–tubulin antibodies. (C) Immunoblot analysis of supernatant (S) and pellet (P) fractions from microtubule polymerization reactions. Blots were probed with anti Kinesin-5, CycD, and α–tubulin antibodies. (D) Purified microtubule pellets and associated proteins were analyzed by SDS-PAGE and stained with Coomassie blue. E = input extract. Microtubule pellets were digested in solution and proteins identified by LC-MS/MS. (E) In silico analysis of 592 genes and encoded proteins, for details see text and Supplemental Information. (F) Generation of a siRNA library targeting 592 genes corresponding to the MMCP set. (A–F) See also Supplemental Experimental Procedures and Tables S1 and S2.
Figure 2
Figure 2. Functional Characterization of MMCPs
(A) Schematic of mitotic arrest and mitotic checkpoint bypass RNAi screens. (B) The mitotic index (MI= # cells phospho-histone H3 positive/total # Hoechst stained nuclei) was quantified per well. (C–D) RNAi screen summary scatter plots for individual oligonucleotides ± taxol. Individual oligonucleotides are spread across the X-axis and MI along the Y-axis. Solid line represents mean and dashed and dotted lines indicate one and two standard deviations from the mean of control oligonucleotides, respectively. (E) Schematic of RNAi screens for detection of increased apoptosis and synergy with taxol to induce apoptosis. (F) The apoptotic index (AI) was quantified as the total caspase 3/7 activities (Caspase-Glo) divided by the total ATP levels (CellTiter-Glo) per well. (G–H) Apoptosis screens summary scatter plots for individual oligonucleotides ±taxol. X-axis indicates oligonucleotides and Y-axis indicates normalized AI. Graphs are as in D. (I) Correlation analysis of individual oligonucleotides in - taxol screens, based on normalized MI (over control oligonucleotides) (Y-axis) versus normalized AI (over control oligonucleotides) (X-axis). Rectangle represents quadrant containing gene depletions with increased MI and AI. Xs represents STARD9 RNAi. (J) List of top hits with increased MI and AI. (A–J) See also Supplemental Experimental Procedures and Table S3.
Figure 3
Figure 3. STARD9 is a Centrosomal Protein Enriched at Daughter Centrioles
(A) Schematic of STARD9 protein composition, including N-terminal kinesin motor domain, FHA domain, predicted coiled coil, and C-terminal START domain. (B) STARD9 motor domain alignment. The STARD9 motor domain shares 49% identity to KIF1A and 52% identity to KIF16B. A conserved insertion within loop 3 of Kinesin-3 family members is highlighted in green. Sequence C-terminal to motor domain, highlighted in blue, contains polarity determining amino acids residues and key residues predicting plus end directionality are in red. (C) Cell cycle subcellular localization of STARD9. HeLa cells were co-stained for STARD9, α-tubulin, and DNA. STARD9 accumulates at the centrosomes from prophase to late anaphase, see arrows (Bar = 5 μm). (D) Co-staining of STARD9, α-tubulin, DNA, and either centrin, pericentrin, γ-tubulin, NuMA, TPX2, or Kinesin-5. Zoom depicts magnified view of two centrosomes in one cell (Bar = 5 μm). (E) Co-staining of STARD9, α-tubulin, DNA, and centrobin (Bar = 2 μm). Bottom panel is magnified view of one centrosome showing STARD9 and centrobin colocalization. (A–E) See also Supplemental Experimental Procedures and Figures S1, S2 and S3.
Figure 4
Figure 4. STARD9 Microtubule-Binding and ATPase Activities are Required for its Centrosomal Localization
(A) Map2, BSA, GST-Precision, or GST-tagged motor domain (MD)-WT, T110N and R223A were incubated with or without microtubules and their ability to bind microtubules determined by analyzing the supernatant and pellet fractions by SDS-PAGE and Coomassie blue staining. Asterisks indicate protein bands of interest. (B) The ATPase activity of kinesin heavy chain (KHC), GST-Skp1, GST-tagged WT or T110N was assessed by an ATPase end point assay. Activity is in moles/minute/μg. Error bars indicate ±STD. (C) HeLa cells were transfected with eGFP, or eGFP-tagged WT, T110N or R223A for 24 hr. Cells were fixed and co-stained for α-tubulin, DNA, and eGFP (Bar = 5 μm). (D) Recombinant GST-Skp1 or GST-WT were immobilized on a bead matrix and incubated with centrosome preparations. Samples from pelleted beads and supernatants were resolved by SDS-PAGE and immunoblotted for α-tubulin, γ-tubulin, pericentrin, and MCAK. (A–D) See also Supplemental Experimental Procedures.
Figure 5
Figure 5. STARD9 Depletion Induces Fragmentation and Dissociation of the PCM from Centrosomes in Multiple Cancer Types
(A–C) Control or STARD9 siRNA treated HeLa cells were fixed and co-stained for α-tubulin, DNA, and ACA (centromere marker) (A), centrin and pericentrin (B), pericentrin and γ-tubulin (C). (D) Quantitation of the percentage of interphase (Int) and mitotic (Mito) cells with greater than two pericentrin foci. (E) HeLa, HCT116, H460, M395, U2OS, MCF7, MCF10a, hTERT-RPE-1, lymphoblast, and fibroblast cells were treated with siControl or siSTARD9 for 48 hr. Cells were fixed and co-stained for DNA, α-tubulin and pericentrin and the percentage of mitotic cells with greater than two pericentrin foci was quantified. (F) The same analysis in E was carried out with panels of melanoma and non-small-cell lung carcinoma cell lines (NSCLC). (G) STARD9 mRNA expression levels relative to GAPDH in melanoma and NSCLC cell lines. (H) Overexpression of STARD9-MD partially rescues PCM fragmentation. Cells were co-transfected with siSTARD9 and vectors expressing eGFP, or siRNA resistant eGFP-tagged STARD9 motor domain WT, T110N, or R223A. Data represent the average ± SD of 3 independent experiments, 100 cells counted for each. **p < 0.005. (I) Overexpression of the STARD9 motor domain leads to a dominant negative phenotype. EGFP-tagged STARD9 motor domain WT, T110N, or R223A were expressed for 48 hr in HeLa cells and the percentage of cells with greater than two pericentrin foci was quantified as in H *p < 0.05. (D–I) Error bars indicate ±STD. (A–E) See also Supplemental Experimental Procedures, Figures S3, S4, S5 and Tables S4 and S5.
Figure 6
Figure 6. STARD9 is not Required for Recruitment of Spindle Pole Focusing Activities and its Depletion Activates the SAC
(A–E) Control or STARD9 siRNA treated HeLa cells were fixed and co-stained for STARD9, α-tubulin, DNA, and NEK2 (A), NuMA (B), Kinesin-5 (C), BUBR1 (D) and AurKB (E). Bar = 2 μm. (A–E) See also Supplemental Experimental Procedures and Figure S6.
Figure 7
Figure 7. STARD9 Depletion Induces Mitotic Apoptosis and Synergizes with Taxol
(A–B) Time-lapse microscopy of HeLa-GFP-H2B cells treated with control or STARD9 siRNA, frames are at 5-minute intervals (see Movies S1 and S2). (B) Twenty siControl or siSTARD9 cells were visualized by time-lapse microscopy and chromosome congression and mitotic outcome were quantified. (C) Visualization of DNA fragmentation in siControl or siSTARD9 HeLa cells with the DeadEnd Fluorometric TUNEL assay. Cells were fixed and imaged 5 hr post mitotic entry. (D) Caspase 3/7 and 9 activity was determined for siControl, siSTARD9, or siPlk1 HeLa cells. The apoptotic index (AI, Caspase-Glo/CellTiter-Glo) was quantified and plotted on a log scale as arbitrary units. (E) STARD9 depletion decreases cell viability. Total ATP levels (CellTiter-Glo assay) were quantified in siControl and siSTARD9 cells at indicated time points post siRNA transfection. (F) Depletion of STARD9 synergizes with taxol treatment and is dependent on the spindle assembly checkpoint. Cells treated with control, STARD9, BUBR1, or STARD9 + BUBR1 siRNA were incubated with increasing concentrations (0–10 μm) of taxol and the apoptotic index was quantified as in D. Additionally, the small molecule ZVAD was added to STARD9 siRNA-treated cells. (G) Model: STARD9 localizes to daughter centrioles in prophase and stabilizes the PCM during bipolar spindle assembly. (B, E, F) Error bars indicate ±STD. (A–G) See also Supplemental Experimental Procedures, Figure S7, and Movies S1 and S2.

Similar articles

Cited by

References

    1. Abal M, Keryer G, Bornens M. Centrioles resist forces applied on centrosomes during G2/M transition. Biol Cell. 2005;97:425–434. - PubMed
    1. Alpy F, Tomasetto C. Give lipids a START: the StAR-related lipid transfer (START) domain in mammals. J Cell Sci. 2005;118:2791–2801. - PubMed
    1. Barrera JA, Kao LR, Hammer RE, Seemann J, Fuchs JL, Megraw TL. CDK5RAP2 regulates centriole engagement and cohesion in mice. Dev Cell. 2010;18:913–926. - PMC - PubMed
    1. Blangy A, Chaussepied P, Nigg EA. Rigor-type mutation in the kinesin-related protein HsEg5 changes its subcellular localization and induces microtubule bundling. Cell Motil Cytoskeleton. 1998;40:174–182. - PubMed
    1. Carter SL, Eklund AC, Kohane IS, Harris LN, Szallasi Z. A signature of chromosomal instability inferred from gene expression profiles predicts clinical outcome in multiple human cancers. Nat Genet. 2006;38:1043–1048. - PubMed

Publication types