. 2011 Dec 9;147(6):1408-19.
doi: 10.1016/j.cell.2011.11.013.

Comprehensive genome-wide protein-DNA interactions detected at single-nucleotide resolution

Affiliations

Comprehensive genome-wide protein-DNA interactions detected at single-nucleotide resolution

Ho Sung Rhee et al. Cell. .

Abstract

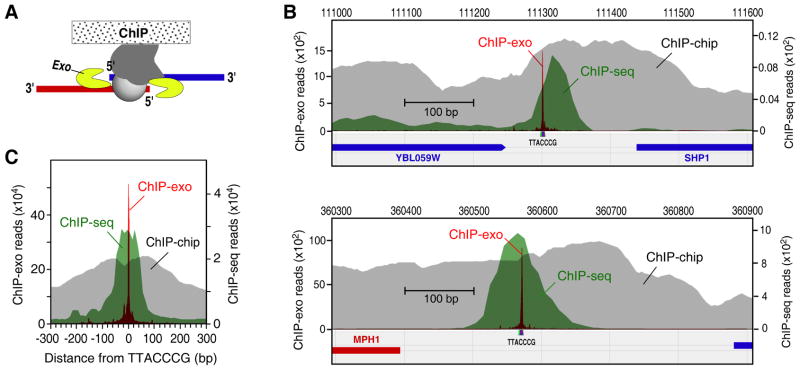
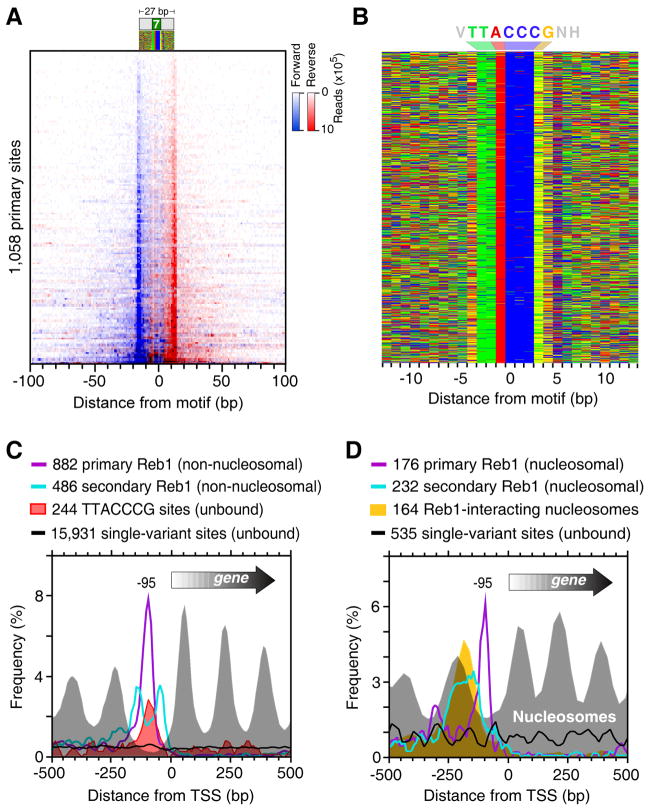
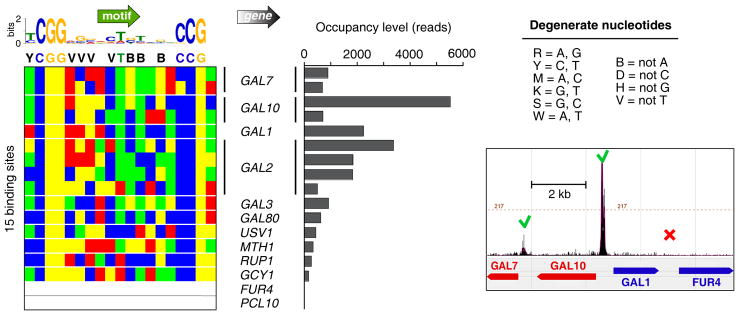
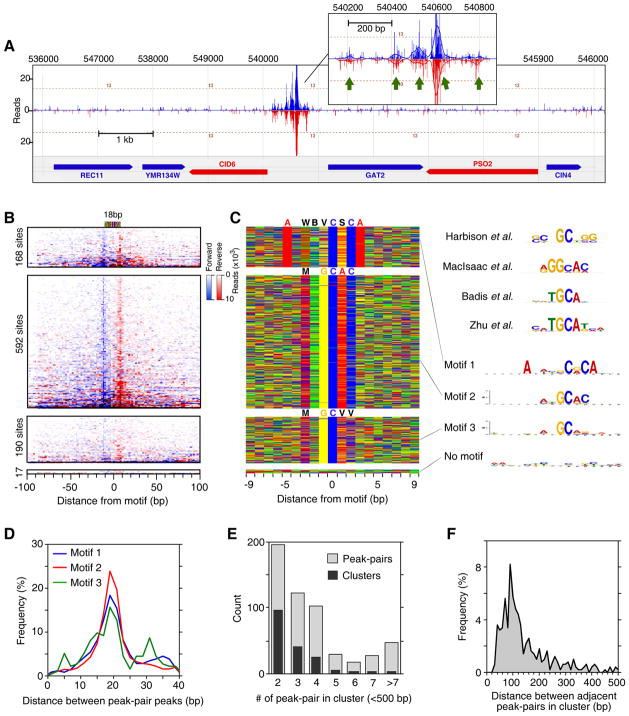
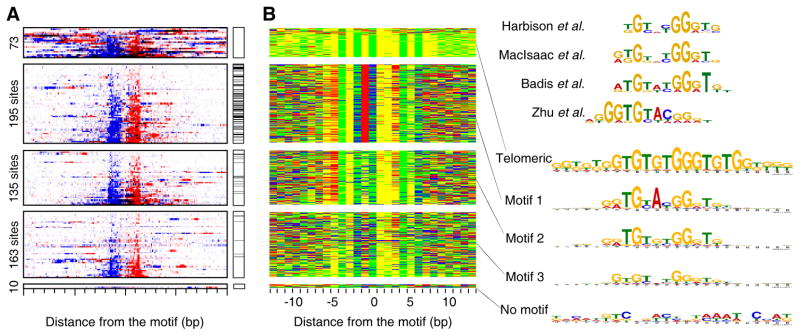
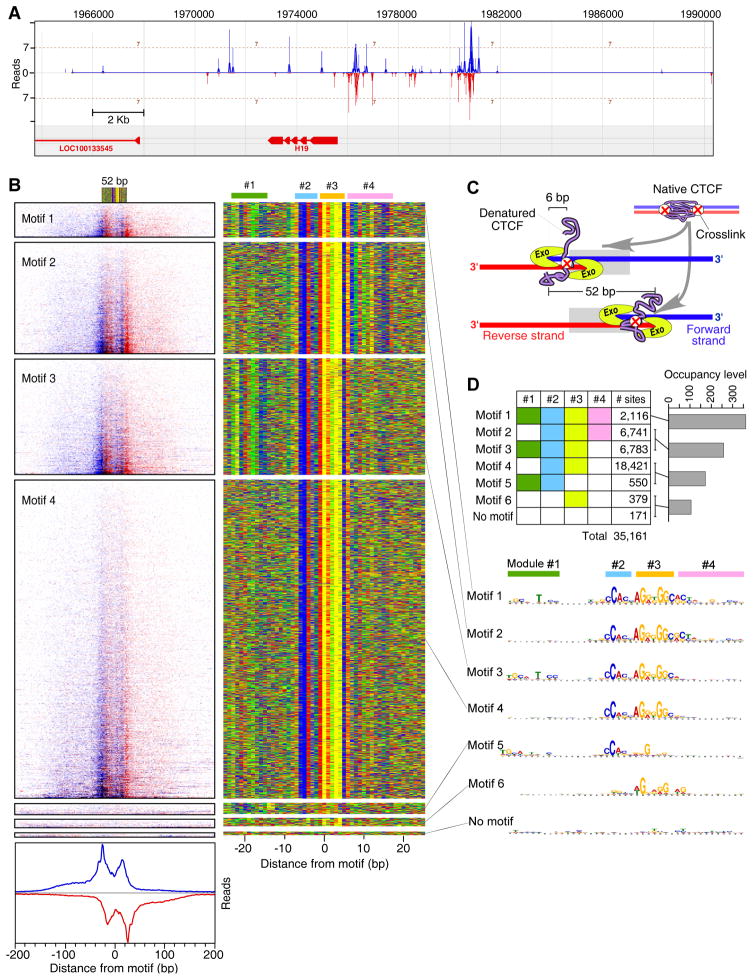
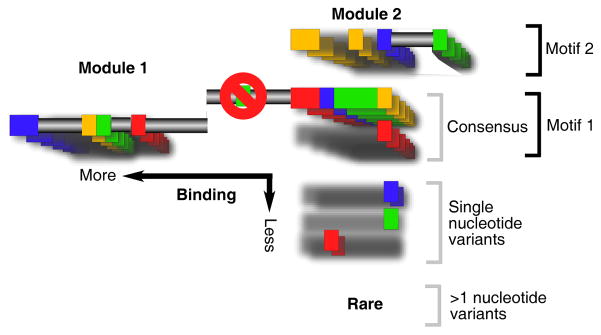
Chromatin immunoprecipitation (ChIP-chip and ChIP-seq) assays identify where proteins bind throughout a genome. However, DNA contamination and DNA fragmentation heterogeneity produce false positives (erroneous calls) and imprecision in mapping. Consequently, stringent data filtering produces false negatives (missed calls). Here we describe ChIP-exo, where an exonuclease trims ChIP DNA to a precise distance from the crosslinking site. Bound locations are detectable as peak pairs by deep sequencing. Contaminating DNA is degraded or fails to form complementary peak pairs. With the single bp accuracy provided by ChIP-exo, we show an unprecedented view into genome-wide binding of the yeast transcription factors Reb1, Gal4, Phd1, Rap1, and human CTCF. Each of these factors was chosen to address potential limitations of ChIP-exo. We found that binding sites become unambiguous and reveal diverse tendencies governing in vivo DNA-binding specificity that include sequence variants, functionally distinct motifs, motif clustering, secondary interactions, and combinatorial modules within a compound motif.


Figures

Figure 1
Figure 1. Single Base-Pair Resolution of ChIP-Exo
(A) Illustration of the ChIP-exo method. ChIP DNA is treated with a 5′ to 3′ exonuclease while still present within the immunoprecipitate. The 5′ ends of the digested DNA are concentrated at a fixed distance from the sites of crosslinking, and are detected by deep sequencing (see also Figure S1). (B) Comparison of ChIP-exo to ChIP-chip and ChIP-seq for Reb1 at specific loci. The gray, green, and magenta filled plots, respectively show the distribution of raw signals, measured by ChIP-chip using Affymetrix microarrays having 5 bp probe spacing (Venters and Pugh, 2009), ChIP-seq, and ChIP-exo. Sequencing tags on each strand were shifted towards the 3′ direction by 14 bp so as maximize opposite-strand overlap. (C) Aggregated raw Reb1 signal distribution around all 791 instances of TTACCCG in the yeast genome. The ChIP-seq and ChIP-exo datasets included 2,938,677, and 2,920,571 uniquely-aligned tags, respectively.
Figure 2
Figure 2. Genome-Wide Identification of Reb1-Bound Locations
(A) Raw sequencing tag distribution around 1,058 primary Reb1-bound locations (rows). Blue and red indicate the 5′ ends of forward (left border) and reverse strand tags (right border), respectively, centered by the motif midpoint, and sorted by Reb1 occupancy level. (B) Color chart representation of 27 bp of DNA sequence located between each Reb1 peak-pair, and centered by the motif midpoint. Each row represents a bound sequence ordered as in panel A. Red, green, yellow, and blue indicates A, T, G, and C. The Reb1 consensus sequence is indicated as VTTACCCGNH (V=A/C/G, H=A/T/C) (see also Discussion). (C) Distribution of non-nucleosomal primary (purple trace) and secondary (cyan trace) Reb1 bound locations and respective nucleosome dyads (gray fill) around the TSS. Locations that were within 100 bp of a nucleosome midpoint (Figure S2I) were removed and plotted in panel D. Distribution traces of all unbound (<2% of average occupancy) TTACCCG sites and single nucleotide variants are shown by the red fill and black traces, respectively. (D) Distribution of nucleosomal primary (purple trace) and secondary (cyan trace) Reb1 bound locations and respective nucleosome dyads (gray fill) around the TSS. The distribution of previously determined Reb1-bound nucleosome dyads is shown by the orange fill (Koerber et al., 2009). Distributions of unbound single nucleotide variants for those genes are shown by the black trace.
Figure 3
Figure 3. Genome-Wide Identification of Gal4-Bound Locations
The left panel shows a color chart representation of 18 bp of sequence located between each Gal4 peak-pair. Sites are oriented such that the nearest TSS is on the same strand. A MEME output logo is shown, along with a single-letter degenerate code of the surmised consensus (definition of the code is to the right). The bar graph shows the occupancy level at these sites. Also shown is a browser shot of Gal4 ChIP-exo tags around the contiguous GAL7, 10, 1, - FUR4 region. Sequencing tags on each strand were shifted towards the 3′ direction by 13 bp.
Figure 4
Figure 4. Genome-Wide Identification of Phd1-Bound Locations
(A) Example of Phd1 binding at the GID6-GAT2 locus. Green arrows indicate Phd1 motifs. Vertical blue and red bars demarcate the 5′ ends of forward and reverse strand tags, respectively, shifted in the 3′ direction by 10 bp. (B) Raw sequencing tag distribution around 967 Phd1-bound locations. Blue and red indicate the 5′ ends of forward and reverse strand tags, respectively, centered by the motif midpoint. Rows were divided into four groups based upon the type of motif shown in panel C, and sorted by Phd1 occupancy level. The additional tags distributed distal to the main peaks reflect multiple Phd1 peak-pairs residing near each other. See Figure S4C for Gene Ontology analysis. (C) Color chart representation of 19 bp of sequence located between each Phd1 peak-pair, and centered by the motif midpoint. Each row represents a bound sequence ordered as in panel B. MEME logos for each group are shown to the right. The upper four logos were reprinted from the indicated references. (D) Frequency distribution of Phd1 peak-pair distances for groups defined by motifs 1–3. (E) Multiple Phd1 peak-pairs reside in clusters. Black bars indicate the number of Phd1 clusters found having the indicated number of peak-pairs within 500 bp of each other. Light bars indicate the total number of peak-pairs present in those clusters. (F) Frequency distribution of distances between adjacent peak-pairs in clusters defined in panel E.
Figure 5
Figure 5. Genome-Wide Identification of Rap1-Bound Locations
(A) Raw sequencing tag distribution around 576 Rap1-bound locations. Blue and red indicate the 5′ ends of forward and reverse strand tags, respectively, centered by the motif midpoint. Rows were divided into four groups based upon the type of motif shown in panel B, and sorted by Rap1 occupancy level. The additional tags distributed distal to the main peaks reflect multiple Rap1 peak-pairs residing near each other. Black horizontal lines indicate the distribution of ribosomal protein (RP) genes having a TSS between 100 bp upstream and 700 bp downstream of a Rap1 location. (B) Color chart representation of 27 bp of sequence located between each Rap1 peak-pair, and centered by the motif midpoint. Each row represents a bound motif ordered as in panel A. MEME logos are shown to the right. The upper four motifs were reprinted from the indicated references.
Figure 6
Figure 6. Genome-Wide Identification of Human CTCF-Bound Locations
(A) Example of CTCF binding at the H19 locus. Vertical blue and red bars demarcate the 5′ ends of forward and reverse strand tags, respectively. (B) The left panel shows raw sequencing tags distributed around 8,578 CTCF-bound locations present on chromosomes 1, 2, and 3. Blue and red indicate the 5′ ends of forward and reverse strand tags, respectively, centered by the motif midpoint. Rows were divided into six groups based upon the type of motif shown in the right panel. Summed tag counts are shown on the bottom of the left panel. The right panel shows a color chart representation of 52 bp sequence located between the most 5′ borders on each strand, and centered by the motif midpoint. Each row represents a bound motif ordered as in the left panel. Locations of four CTCF site modules are drawn on the top of the right panel. (C) Model explaining the presence of four exonuclease blockage sites (two peak-pairs) for each CTCF-bound location. CTCF is illustrated as a native protein (purple) during the crosslinking. Two crosslinks are shown to represent a population distribution. However, any one CTCF molecule is likely to contain 0–1, and rarely 2, crosslinks. CTCF is shown in its denatured state during the exonuclease treatment, with one crosslink occurring at either site. (D) Table colored to demarcate the combinatorial usage of the four CTCF site modules. Corresponding median tag counts for the specified motifs having different number of modules are shown as a bar graph. MEME logos for each motif and corresponding CTCF site module are shown below.
Figure 7
Figure 7. Themes in Genomic Binding Site Organization
Shown is an amalgamation of hypothetical DNA recognition sequences. Each color represents one of four nucleotides (A, C, T or G) that constitute a recognition site. The core sequence is shown as a series of color boxes. For simplicity, alternative nucleotides to the core sequence are represented as additional boxes, with constant nucleotides represented as a gray shadow. Frequently used alternatives form a consensus motif, as indicated. Collectively, single-nucleotide variants are shown to be common, although any particular variant occurs infrequently. Also shown are alternative motifs, and compound motifs that are built up combinatorially from modules. Multiple motifs may exist in clusters (not shown). A position that excludes a certain nucleotide is shown as a red circle with a line drawn through. Regions where any nucleotide would suffice are drawn as a gray horizontal bars. Variants having >1 nucleotide variation from the core are designated as rare, but this should be qualified to short, well-defined motifs. Long motifs tend to have many degenerate positions.

Comment in

References

    1. Albert I, Mavrich TN, Tomsho LP, Qi J, Zanton SJ, Schuster SC, Pugh BF. Translational and rotational settings of H2A.Z nucleosomes across the Saccharomyces cerevisiae genome. Nature. 2007;446:572–576. - PubMed
    1. Albert I, Wachi S, Jiang C, Pugh BF. GeneTrack - a genomic data processing and visualization framework. Bioinformatics 2008 - PMC - PubMed
    1. Badis G, Berger MF, Philippakis AA, Talukder S, Gehrke AR, Jaeger SA, Chan ET, Metzler G, Vedenko A, Chen X, et al. Diversity and complexity in DNA recognition by transcription factors. Science. 2009;324:1720–1723. - PMC - PubMed
    1. Badis G, Chan ET, van Bakel H, Pena-Castillo L, Tillo D, Tsui K, Carlson CD, Gossett AJ, Hasinoff MJ, Warren CL, et al. A library of yeast transcription factor motifs reveals a widespread function for Rsc3 in targeting nucleosome exclusion at promoters. Mol Cell. 2008;32:878–887. - PMC - PubMed
    1. Bailey TL, Boden M, Buske FA, Frith M, Grant CE, Clementi L, Ren J, Li WW, Noble WS. MEME SUITE: tools for motif discovery and searching. Nucleic Acids Res. 2009;37:W202–208. - PMC - PubMed

Publication types