. 2011 Dec 8;72(5):721-33.
doi: 10.1016/j.neuron.2011.10.028.

Recombinase-driver rat lines: tools, techniques, and optogenetic application to dopamine-mediated reinforcement

Affiliations

Recombinase-driver rat lines: tools, techniques, and optogenetic application to dopamine-mediated reinforcement

Ilana B Witten et al. Neuron. .

Abstract

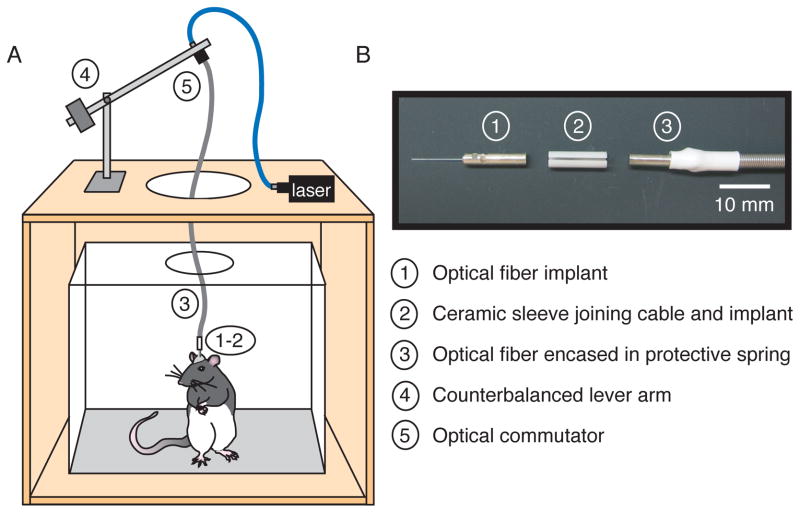
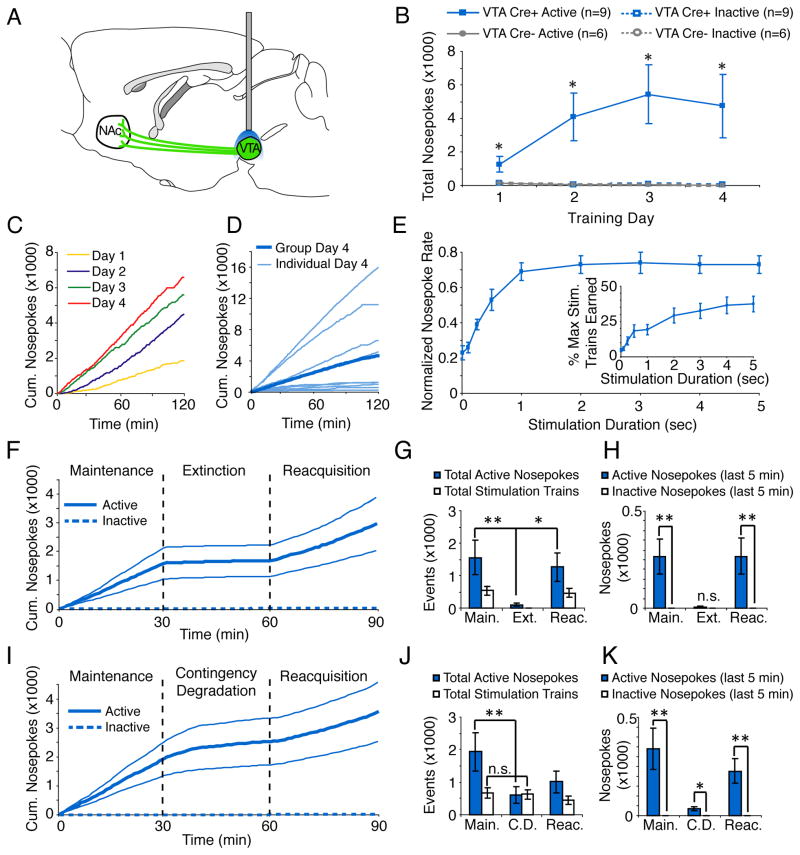
Currently there is no general approach for achieving specific optogenetic control of genetically defined cell types in rats, which provide a powerful experimental system for numerous established neurophysiological and behavioral paradigms. To overcome this challenge we have generated genetically restricted recombinase-driver rat lines suitable for driving gene expression in specific cell types, expressing Cre recombinase under the control of large genomic regulatory regions (200-300 kb). Multiple tyrosine hydroxylase (Th)::Cre and choline acetyltransferase (Chat)::Cre lines were produced that exhibited specific opsin expression in targeted cell types. We additionally developed methods for utilizing optogenetic tools in freely moving rats and leveraged these technologies to clarify the causal relationship between dopamine (DA) neuron firing and positive reinforcement, observing that optical stimulation of DA neurons in the ventral tegmental area (VTA) of Th::Cre rats is sufficient to support vigorous intracranial self-stimulation (ICSS). These studies complement existing targeting approaches by extending the generalizability of optogenetics to traditionally non-genetically-tractable but vital animal models.


Figures

Figure 1
Figure 1. Specific ChR2-YFP expression in the VTA, SN, and LC of Th::Cre rats
A. Quantification of ChR2-YFP expression profile in several Th::Cre sublines (VTA: line 2.1 n=113, line 3.1 n=150, line 3.2 n=190, line 3.5 n=122, line 4.4 n=126; SN: line 3.1 n=86; LC: line 3.1 n=63 where n refers to the number of counted cells that expressed either YFP or TH). Error bars are SEM. B. High magnification view of ChR2-YFP expression and DAPI staining in TH VTA cell bodies after injection of Cre-dependent virus in the VTA of a Th::Cre rat. C. TH staining and ChR2-YFP expression in coronal slices display colocalization in cell bodies (top: VTA and SN) and efferents in the ventral and dorsal striatum (bottom) D. Colocalization of TH staining and ChR2-YFP expression in the LC after injection of Cre-dependent virus in a Th::Cre rat.
Figure 2
Figure 2. In vitro and in vivo physiology of optical responses in VTA DA neurons in Th::Cre rats
A. Example traces from a ChR2-expressing Th::Cre neuron in response to intracellular current injections (Vm: −43mV, 50pA current steps beginning at −500pA). B. Continuous blue light (470nm) evokes large (>500pA) inward currents in ChR2-expressing Th::Cre neurons. Inset, summary graph of population data for photocurrent properties (n=7). C. Representative responses to 20 Hz optical or electrical stimulation trains in ChR2-expressing and YFP-only expressing Th::Cre neurons. Spike size and shape are comparable to those previously reported for these cells. D. Left, ChR2-expressing Th::Cre neurons are able to reliably follow light-evoked pulse trains over a range of frequencies. Right, Summary data for spike fidelity (%successful spikes in 40 light flashes) in ChR2-expressing Th::Cre neurons (n=7; in panels A–D data are from Ih/large ChR2-YFP expressing cells). Errorbars are SEM. E. Optically evoked time-locked multi-unit neural activity recorded with an optrode in vivo in the VTA of anesthetized Th::Cre+ rats injected with Cre-dependent ChR2. Top: 20 Hz, 20 pulses, 5 ms pulse duration, 473 nm. Bottom: same recording site and photostimulation parameters but longer stimulation duration (100 pulses). Horizontal blue lines represent timecourse of optical stimulation.
Figure 3
Figure 3. Voltammetric measurements of optically evoked DA release in vitro in the nucleus accumbens of Th::Cre rats expressing Cre-dependent ChR2 in the VTA
A. Timecourse of DA release at a sample site (20 pulses). B. Timecourse of DA release for various numbers of pulses at a sample site (top); peak DA release as a function of the number of pulses across the population (bottom, n=17). Errorbars are SEM. C. Bath application of TTX (1 uM) blocked optically-evoked DA release (left: before TTX, right: after TTX; 100 pulses. Horizontal blue lines represent timecourse of optical stimulation. In A–C, optical stimulation parameters: 20 Hz, 5 ms pulse duration, 473 nm.
Figure 4
Figure 4. Specificity and functionality of Chat::Cre rats
A. Quantification of YFP expression profile in Chat::Cre sublines in the medial septum (MS) nucleus basalis (NB) and nucleus accumbens (NAc) after injection of a Cre-dependent virus. Errorbars are SEM. B. Colocalization of ChAT staining and YFP expression in the MS (top), NB (middle), and NAc (bottom). C. Membrane potential changes induced by current injection in a ChR2-YFP expressing ChAT neuron. VM = −53 mV. Current steps: −100, +50 pA. D. Voltage clamp recording of a neuron expressing ChR2-YFP in slice showing inward current in response to blue light (1 sec constant illumination, 470 nm). E. Current clamp recording of light-evoked action potentials in a ChAT neuron expressing ChR2-YFP in slice in response to several stimulation frequencies (470 nm, 2 ms pulse duration, 40 pulses). F. In vivo inhibition of multiunit activity in response to optical activation of ChAT cells in the nucleus basalis with ChR2. Top: example voltage trace. Middle: Raster plot from 8 repetitions. Bottom: Time average and SEM (from raster plot). (10 Hz, 10 ms pulse duration, 5 pulses, 473nm)
Figure 5
Figure 5. Rat-optimized integration of optogenetic photostimulation with freely-moving behavior in an operant conditioning chamber
A. Schematic of the behavioral set-up, which was optimized to facilitate freely-moving behavior along with photostimulation (while minimizing the chance of fiber breakage or disconnection). An optical fiber in a metal ferrule was surgically implanted over the targeted brain area (1), and connected with a ceramic sleeve (2) to a patch cable encased in a protective spring (3). A counterbalanced lever arm compensated for accumulation of slack in the patch cable during rearing (4), and an optical commutator (5) enabled the rat to rotate freely in the chamber. B. A close-up view of the implantable fiber in the metal ferrule (1), the ceramic sleeve (2), and the patch cord encased in the protective spring (3).
Figure 6
Figure 6. Optical stimulation of VTA DA neurons supports robust self-stimulation
A. The VTA was injected with a Cre-dependent ChR2 virus, and an optical fiber was implanted above the VTA. B. Nosepokes during 4 days of FR1 training, in which nosepokes at the active port resulted in photostimulation (20 Hz, 20 pulses, 5 ms duration, 473 nm), while nosepokes at the inactive port were without consequence. Th::Cre+ rats performed significantly more active than inactive nosepokes (2-tailed Wilcoxon signed rank test with Bonferroni correction; p<0.05 on days 1–4) C. Cumulative responding at the active nosepoke port across all 4 days of training for a representative Th::Cre+ rat. D. Cumulative responding at the active nosepoke port on Day 4 of FR1 training for all Th::Cre+ rats. Dark blue: population average; light blue: individual rats. E. Normalized nosepoke rate at the active port for Th::Cre+ rats for duration-response test in which the relationship between stimulation duration and response rate was mapped systematically. Before averaging across rats, the nosepoke rate for each rat was normalized to the maximum rate across all stimulus durations. Response rate depended on stimulation duration (Kruskal-Wallis Test, p<0.0001; 20 Hz, 1–100 pulses, 5 ms pulse duration). Inset: Percent of the maximum possible stimulation trains earned as a function of stimulus duration for the same data set. F. Cumulative responding at the active port for Th::Cre+ rats for the within-session extinction test during maintenance, extinction and reacquisition. G. Quantification of total active nosepoke responses and stimulation trains delivered during maintenance, extinction and reacquisition. Response rate decreased during extinction and then increased during reacquistion (2-tailed Wilcoxon signed rank test; p<0.01 for average nosepokes during maintenance vs extinction, p<0.05 for extinction vs reacquisition). H. Quantification of responses at the active and inactive nosepoke ports for the last 5 minutes of maintenance, extinction and reacquisition. Th::Cre+ rats responded preferentially at the active nosepoke port at the end of maintenance and reacquisition, but not extinction (2-tailed Wilcoxon signed rank test; p<0.01). I. Cumulative responding at the active port for Th::Cre+ rats for the within-session contingency degradation test during maintenance, contingency degradation and reacquisition. J. Quantification of total active nosepoke responses and stimulation trains delivered during maintenance, contingency degradation, and reacquisition. Response rate decreased during contingency degradation (2-tailed Wilcoxon signed rank test, p<0.01 for average nosepokes during maintenance vs extinction) K. Quantification of responses at the active and inactive nosepoke ports for the last 5 minutes of maintenance, contingency degradation and reacquisition. Th::Cre+ rats responded preferentially at the active nosepoke port at the end of all 3 phases (2-tailed Wilcoxon signed rank test; p<0.01 for maintenance and reacquisition; p<0.05 for contingency degradation). In all panels, error bars indicate SEM.

References

    1. Adamantidis AR, Tsai HC, Boutrel B, Zhang F, Stuber GD, Budygin EA, Touriño C, Bonci A, Deisseroth K, de Lecea L. J Neurosci. 2011;31(30):10829–10835. - PMC - PubMed
    1. Bari A, Dalley JW, Robbins TW. The application of the 5-choice serial reaction time task for the assessment of visual attentional processes and impulse control in rats. Nat Protoc. 2008;3:759–767. - PubMed
    1. Berke JD, Breck JT, Eichenbaum H. Striatal versus hippocampal representations during win-stay maze performance. J Neurophysiol. 2009;101:1575–1587. - PMC - PubMed
    1. Bielajew C, Shizgal P. Evidence implicating descending fibers in self-stimulation of the medial forebrain bundle. J Neurosci. 1986;6:919–929. - PMC - PubMed
    1. Buzsàki G, Bickford RG, Ryan LJ, Young S, Prohaska O, Mandel RJ, Gage FH. Multisite recording of brain field potentials and unit activity in freely moving rats. J Neurosci Methods. 1989;28:209–217. - PubMed

Publication types

MeSH terms