. 2011 Dec 8;72(5):819-31.
doi: 10.1016/j.neuron.2011.09.008.

Parallel regulation of feedforward inhibition and excitation during whisker map plasticity

Affiliations

Parallel regulation of feedforward inhibition and excitation during whisker map plasticity

David R C House et al. Neuron. .

Abstract

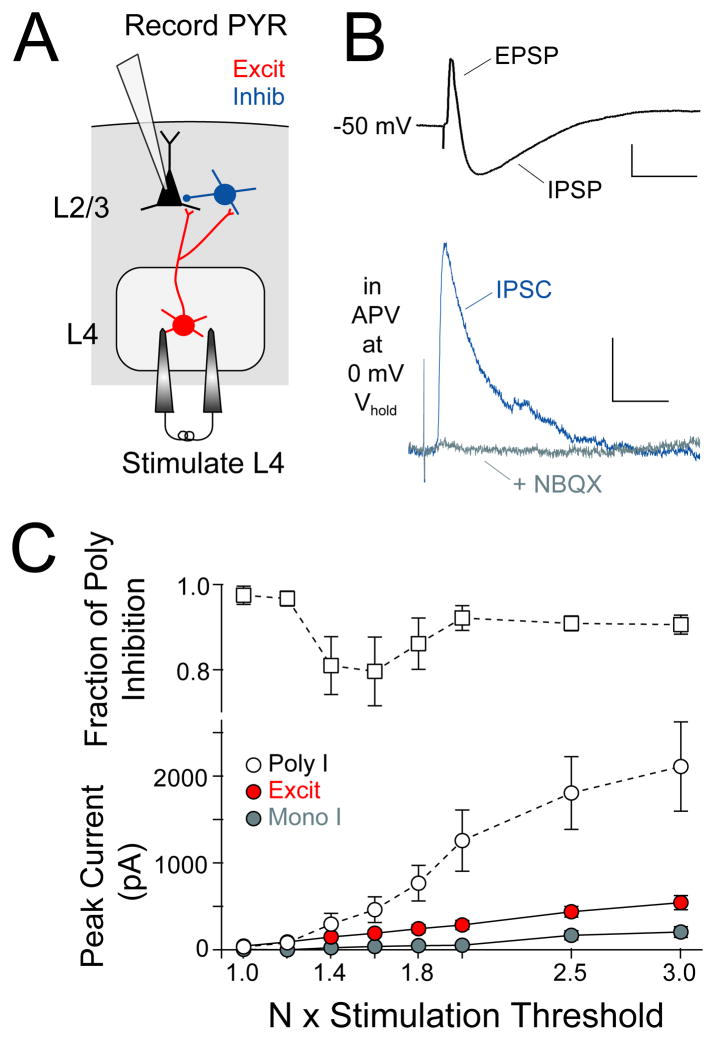
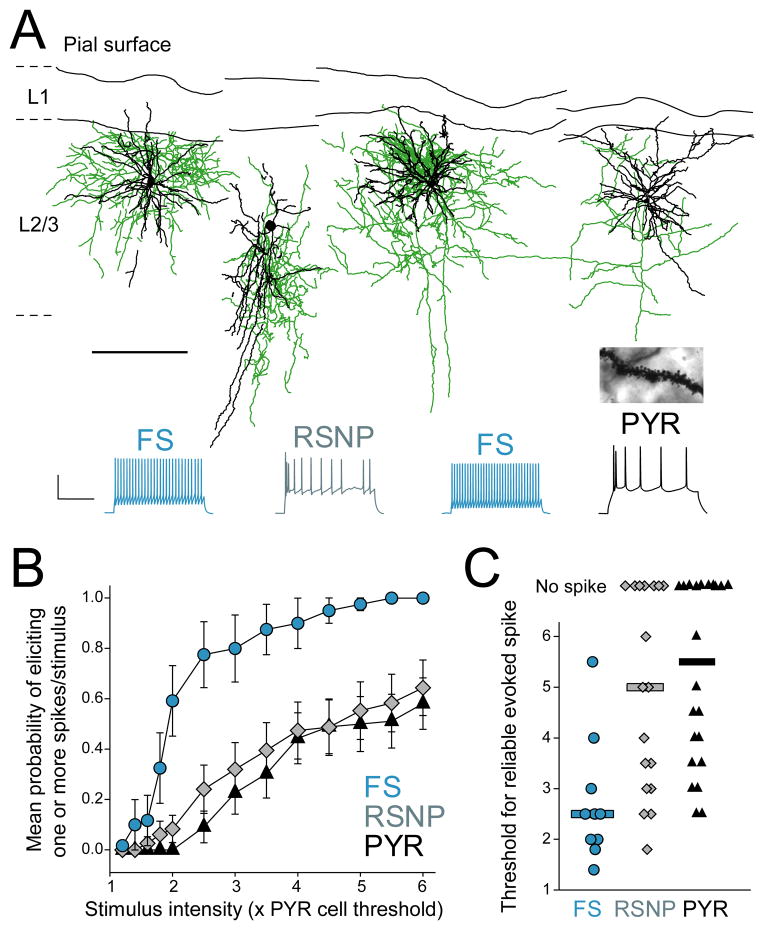
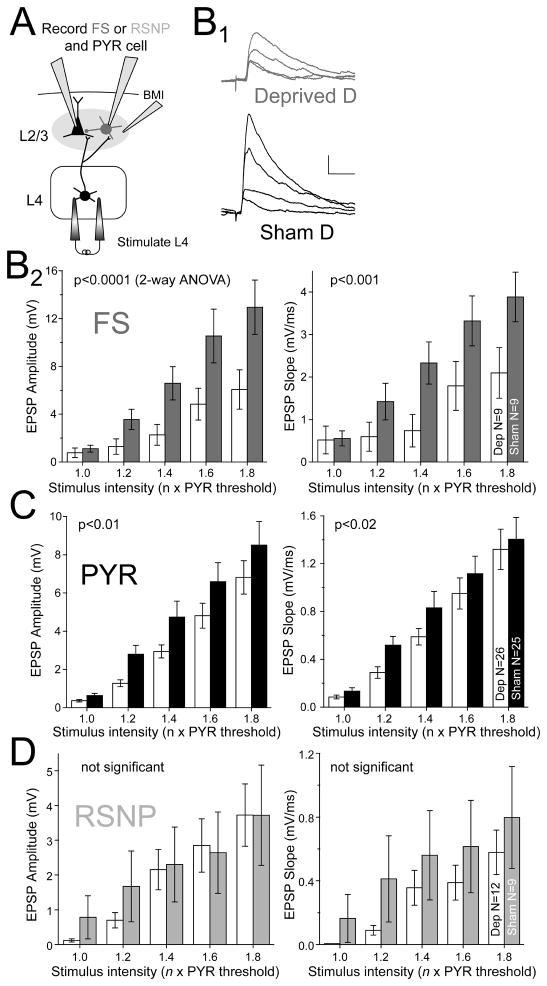
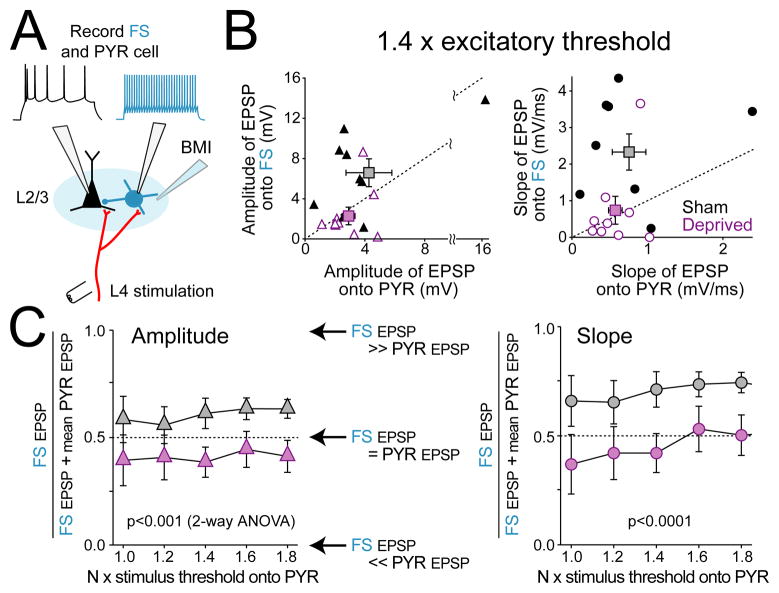
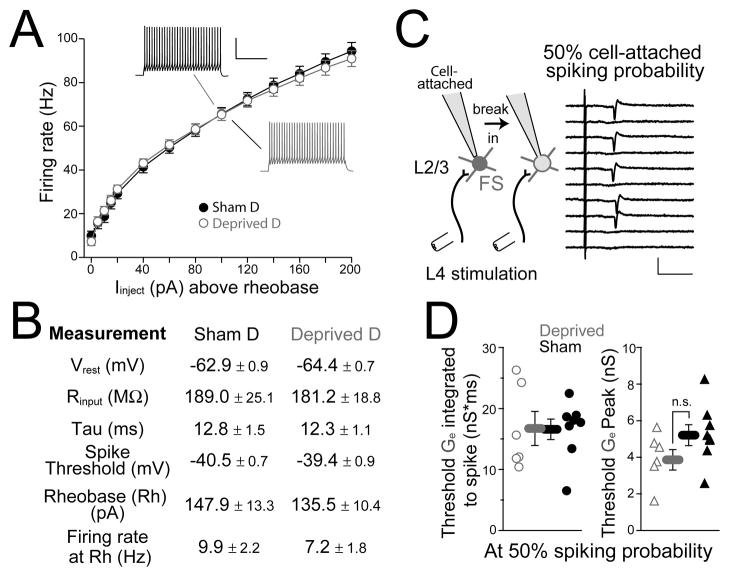
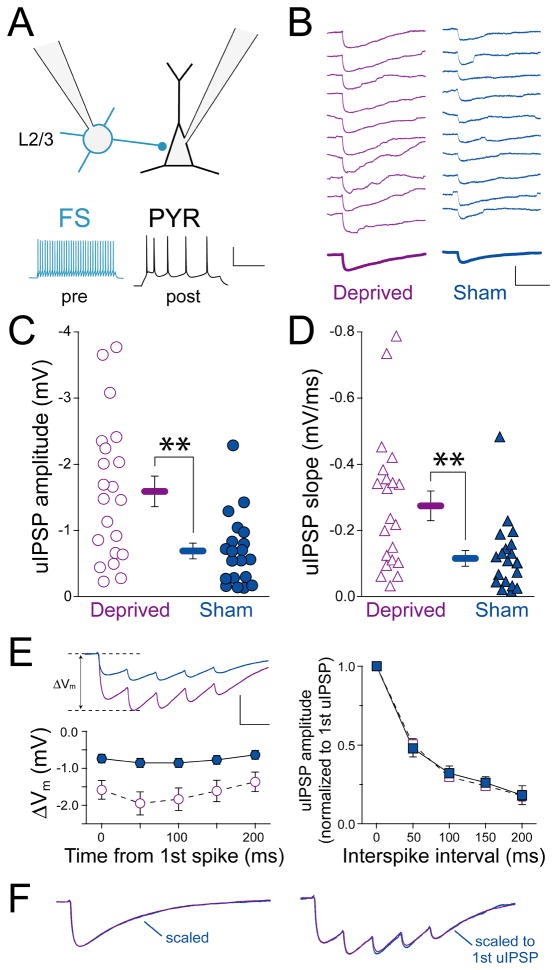
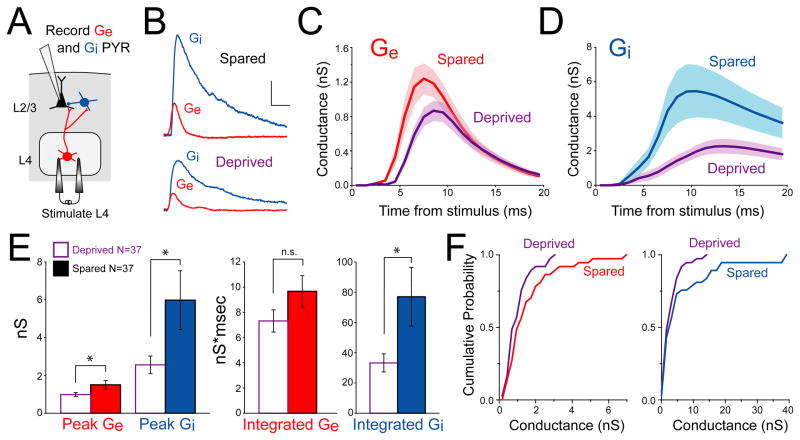
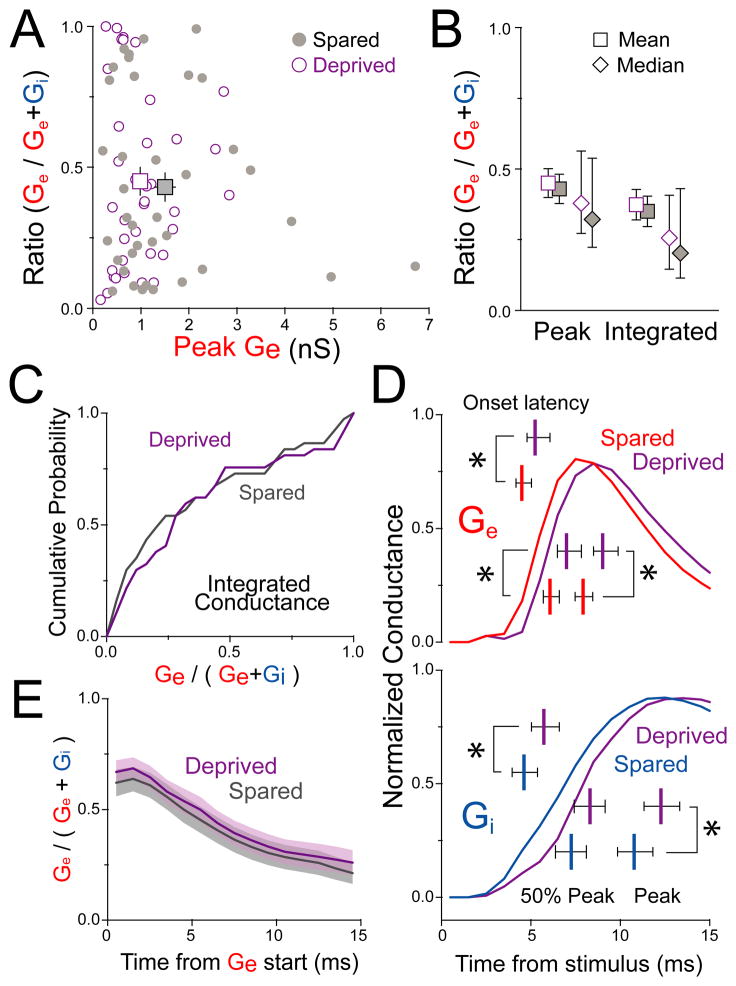
Sensory experience drives robust plasticity of sensory maps in cerebral cortex, but the role of inhibitory circuits in this process is not fully understood. We show that classical deprivation-induced whisker map plasticity in layer 2/3 (L2/3) of rat somatosensory (S1) cortex involves robust weakening of L4-L2/3 feedforward inhibition. This weakening was caused by reduced L4 excitation onto L2/3 fast-spiking (FS) interneurons, which mediate sensitive feedforward inhibition and was partially offset by strengthening of unitary FS to L2/3 pyramidal cell synapses. Weakening of feedforward inhibition paralleled the known weakening of feedforward excitation. As a result, mean excitation-inhibition balance and timing onto L2/3 pyramidal cells were preserved. Thus, reduced feedforward inhibition is a covert compensatory process that can maintain excitatory-inhibitory balance during classical deprivation-induced Hebbian map plasticity.


Figures

Figure 1
Figure 1. Measurement of L4-evoked feedforward inhibition in L2/3 pyramidal cells
(A) Experimental design for recording L4-evoked excitatory and inhibitory responses. (B) Top, Example L4-evoked EPSP-IPSP sequence (scale bar: 2 mV, 50 ms). Bottom, L4-evoked IPSC at 0 mV before and after NBQX, which blocks polysynaptic inhibition (scale bar: 50 pA, 20 ms). (C) Mean input-output curves showing recruitment of IPSCs and EPSCs with increasing L4 stimulation intensity. Mono- and polysynaptic inhibition were separated using NBQX. Top, Fraction of inhibition that was polysynaptic at each stimulation intensity. In this and all figures, data represent mean ± SEM unless otherwise noted.
Figure 2
Figure 2. FS cells mediate L4-evoked feedforward inhibition in L2/3
(A) Example biocytin reconstructions of physiologically identified FS basket, RSNP and PYR cells. Axons are green and dendrites are black (scale bar: 200 μm). Inset, spiny dendrites of putative PYR cell. Below, spike patterns from each cell (scale bar: 40 mV, 200 ms). (B) L4-evoked firing probability of FS cells, RSNP cells and PYR cells. (C) Threshold L4 stimulation intensity to evoke ≥ 1 spike/stimulus in each cell. Bars are median. See also Figure S1.
Figure 3
Figure 3. Deprivation weakens L4 to L2/3 excitation onto FS and pyramidal cells
(A) Experimental design for recording L4 excitation onto L2/3 FS, RSNP, and PYR cells. Bicuculline methiodide (BMI) was applied focally. (B1) L4-evoked EPSPs in two representative FS cells (stimulation intensities: 1.0, 1.2, 1.4, and 1.6 x excitatory response threshold for a co-columnar PYR cell). Scale bar: 1 mV, 20 ms. (B2) Mean input-output curves for L4-evoked EPSPs onto L2/3 FS cells. Significance between deprived and spared columns is shown (ANOVA). (C and D) Mean input-output curves for EPSP amplitude and slope for L2/3 PYR cells (C) and RSNP cells (D). Bars are mean ± SEM.
Figure 4
Figure 4. Deprivation weakens excitation onto FS cells more than onto PYR cells
(A) Experiment design. (B) Comparison of L4-evoked EPSPs onto co-columnar FS and PYR cells (measured at 1.4 x excitatory response threshold). Each symbol is one FS-PYR cell pair. Squares show mean ± SEM. Diagonal shows equality. (C) Relative excitation onto FS vs. PYR cells, quantified as (FS EPSP/(FS EPSP + mean pyramidal EPSP)), for each L4 stimulation intensity. Left, quantification for EPSP amplitude. Right, for EPSP slope. Dashed line indicates equal EPSPs onto FS and PYR cells. When more than one PYR cell was recorded in a single column, the mean EPSP value was used.
Figure 5
Figure 5. Intrinsic and synaptically driven excitability of FS cells are unaltered by deprivation
(A) Current-firing rate relationship for FS cells, for 500-ms current injection. Rheobase is the current required to elicit a single spike. Scale bar: 40 mV, 200 ms. (B) Intrinsic properties of FS cells in deprived vs. sham-deprived D columns. Tau is the membrane time constant. (C) Left, experimental design to measure the L4-evoked excitatory conductance required to elicit 50% spike probability in an FS cell. Right, consecutive sweeps showing L4-evoked spikes recorded in cell-attached mode from an FS cell at 50% spike probability. Scale bar: 50 pA, 10 ms. (D) Peak and integrated Ge at 50% spike probability (integrated from response onset to spike latency for each neuron) for cells from deprived vs. sham-deprived rats. See also Figure S2.
Figure 6
Figure 6. Deprivation potentiates L2/3 FS→PYR unitary IPSPs
(A) Experimental design with example pre- and postsynaptic spike patterns. Scale bar: 50 mV, 200 ms. (B) Consecutive single-sweep uIPSPs from a deprived and a sham-deprived L2/3 FS→PYR pair. Bold, average uIPSP. Scale bar: 2.5 mV, 100 ms. (C, D) Mean uIPSP amplitude and slope for each connected pair. Bars are mean ± SEM; **, p < 0.01. (E) Responses to trains of 5 FS spikes (50 ms interval). Top, average uIPSP train for 20 deprived FS→PYR pairs and 19 sham-deprived pairs. Bottom left, mean ΔVm for each uIPSP in the train. Scale bar: 1 mV, 50 ms. Right, amplitude of each uIPSP normalized to first uIPSP amplitude, showing no difference in short-term plasticity between deprived and sham-deprived pairs. (F) Left, mean single-spike uIPSP for all cells in deprived and sham-deprived columns, peak normalized to show IPSP decay kinetics. Right, mean response to 5-spike train, normalized to the first uIPSP peak (same scale bar as in E).
Figure 7
Figure 7. Whisker deprivation reduces L4-evoked excitation and inhibition onto L2/3 pyramidal cells
(A) Experimental design. (B) Example Ge and Gi measured in two L2/3 pyramidal cells. Scale bar: 1 nS, 10 ms. (C and D) Average Ge and Gi waveforms for neurons in spared vs. deprived columns. 1 ms bins. Shading shows SEM. (E) Peak (left) and integrated (right) Ge and Gi in spared vs. deprived columns; *, p < 0.05. (F) Cumulative distribution of peak data from (E). See also Figure S3 and S4.
Figure 8
Figure 8. Deprivation preserves the balance and relative timing of excitation and inhibition
(A) Ge fraction is broadly distributed and not altered by deprivation. (B) Mean ± SEM and median ± 95 % confidence intervals for Ge fraction calculated from peak or integrated Ge and Gi. (C) Cumulative distribution of Ge fraction based on integrated conductance. (D) Mean peak-normalized Ge and Gi recorded in spared B vs. deprived D columns. Bars, mean ± 95% confidence intervals for Ge and Gi onset latency, latency to 50% of peak and peak latency. *, p < 0.05, ranksum test. (E) Ge fractional conductance over the first 15 ms from Ge start. See also Table S1 and Figure S5.

References

    1. Allen CB, Celikel T, Feldman DE. Long-term depression induced by sensory deprivation during cortical map plasticity in vivo. Nat Neurosci. 2003;6:291–299. - PubMed
    1. Bender KJ, Allen CB, Bender VA, Feldman DE. Synaptic basis for whisker deprivation-induced synaptic depression in rat somatosensory cortex. J Neurosci. 2006;26:4155–4165. - PMC - PubMed
    1. Bender KJ, Rangel J, Feldman DE. Development of columnar topography in the excitatory layer 4 to layer 2/3 projection in rat barrel cortex. J Neurosci. 2003;23:8759–8770. - PMC - PubMed
    1. Broser P, Grinevich V, Osten P, Sakmann B, Wallace DJ. Critical period plasticity of axonal arbors of layer 2/3 pyramidal neurons in rat somatosensory cortex: layer-specific reduction of projections into deprived cortical columns. Cereb Cortex. 2008;18:1588–1603. - PMC - PubMed
    1. Bruno RM, Simons DJ. Feedforward mechanisms of excitatory and inhibitory cortical receptive fields. J Neurosci. 2002;22:10966–10975. - PMC - PubMed

Publication types

MeSH terms

Substances