. 2011 Dec 8;72(5):873-84.
doi: 10.1016/j.neuron.2011.09.028.

Patterns of coordinated anatomical change in human cortical development: a longitudinal neuroimaging study of maturational coupling

Affiliations

Patterns of coordinated anatomical change in human cortical development: a longitudinal neuroimaging study of maturational coupling

Armin Raznahan et al. Neuron. .

Abstract

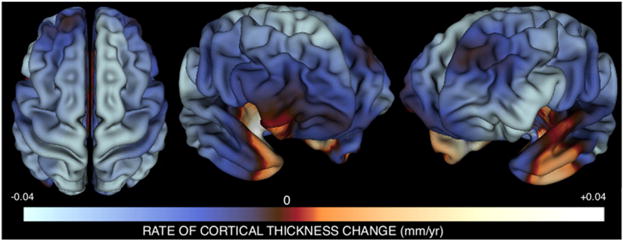
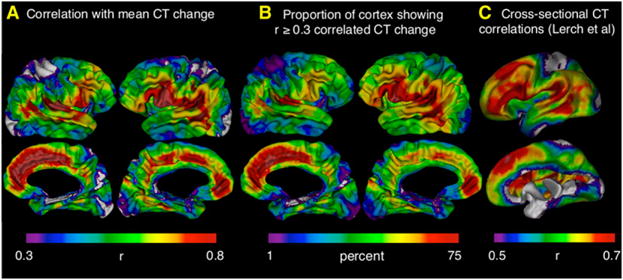
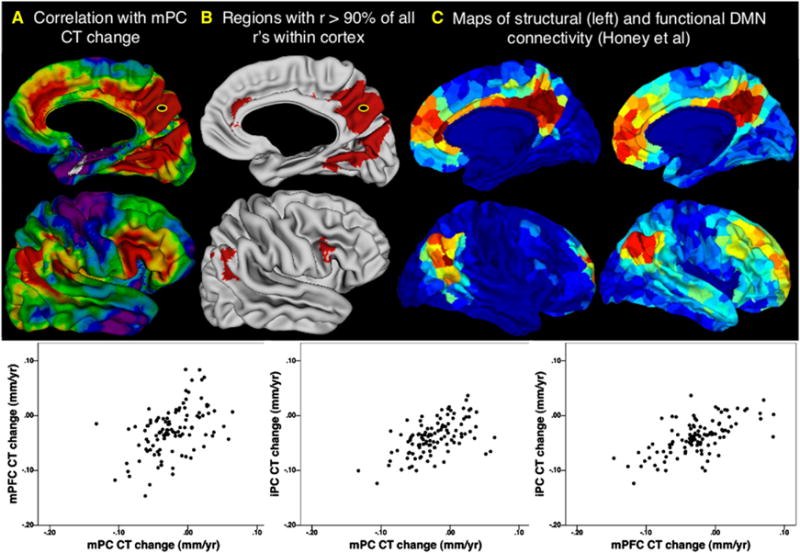
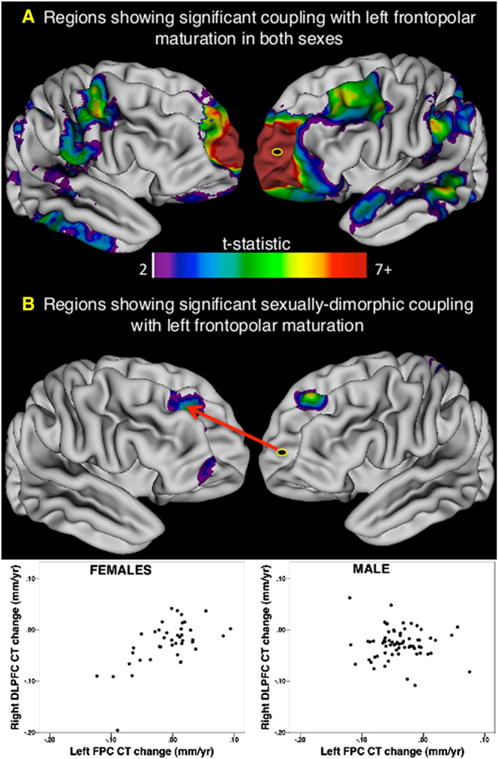
Understanding of human structural brain development has rapidly advanced in recent years, but remains fundamentally "localizational" in nature. Here, we use 376 longitudinally acquired structural brain scans from 108 typically developing adolescents to conduct the first study of coordinated anatomical change within the developing cortex. Correlation in rates of anatomical change was regionally heterogeneous, with fronto-temporal association cortices showing the strongest and most widespread maturational coupling with other cortical areas, and lower-order sensory cortices showing the least. Canonical cortical systems with rich structural and functional interconnectivity showed significantly elevated maturational coupling. Evidence for sexually dimorphic maturational coupling was found within a frontopolar-centered prefrontal system involved in complex decision-making. By providing the first link between cortical connectivity and the coordination of cortical development, we reveal a hitherto unseen property of healthy brain maturation, which may represent a target for neurodevelopmental disease processes, and a substrate for sexually dimorphic behavior in adolescence.


Figures

Figure 1
Figure 1. Mapping the Mean Rate of CT Change per Year between Ages 9 and 22 Years using Person-Specific Estimates of CT Change
Three views of the cortical sheet are shown. Colors represent the magnitude of mean annual cortical thickness (CT) change within our sample at each vertex. Mean change values were derived by averaging estimates of weighted annual CT change across all participants. Over the age range studied, most cortical regions are becoming thinner with advancing age, with the exception of bilateral anterior-medial temporal and right orbitofrontal cortices where CT is still increasing with age. This approach to mapping annual CT change closely replicates results derived using traditional mixed-model approaches for analyzing longitudinal data (Figure S1), and converges with other larger mixed-model studies of CT change (Shaw et al., 2008), but has the added advantage of permitting correlational analysis of interindividual differences in CT change at different vertices.
Figure 2
Figure 2. Regional Differences in Correlation with Rates of CT Change throughout the Cortical Sheet
(A) Map of correlation strength between CT change at each vertex and mean CT change across all vertices. This map has been arbitrarily thresholded at r ≥ 0.3 to highlight its similarity with a previously published thresholded map of cross-sectional CT correlations throughout the cortical sheet (Lerch et al., 2006). An unthresholded version of this map is provided in Figure S2A. Note that the strongest correlations with mean CT change are seen in fronto-temporal association cortices, whereas weakest correlations with mean CT change are seen in primary sensory cortices. (B) An alternative representation of regional differences in maturational coupling. The color at a given cortical region represents the proportion of the cortical surface showing correlated CT change with the region in question at r ≥ 0.3. “Warmer” colors refer to higher proportions. Fronto-temporal regions show the most spatially extensive maturational coupling whereas primary sensory cortices show the least. (C) A reproduction of earlier published (Lerch et al., 2006) maps showing the correlation between cross-sectional variation in CT at each vertex and mean CT across the whole vertex. Note the convergence between these maps and those for correlated CT change shown in (A) and (B).
Figure 3
Figure 3. Maturational Coupling within the Default Mode Network
(A) Right hemisphere map of maturational coupling with the medial posterior cortex (mPC) default mode network (DMN) node. Color gradations represent correlation centile position in the distribution of all possible correlations between cortical vertices (blue → red: 1st → 100th centile). (B) Regions where correlations with mPC change are in the top 90% of all possible correlations. Note mPFG and iPC overlaps between the distribution of regions showing highly coordinated maturation with the mPC DMN seed, and the distribution of regions that show high functional and structural connectivity within the DMN. (C and D) Figures from Honey et al. (2009) depicting the DMN by analysis of diffusion tensor imaging and functional magnetic imaging resonance data, respectively.
Figure 4
Figure 4. Maturational Coupling with the Left Frontopolar Cortex and Its Variation by Sex
The left frontopolar cortex (FPC) was used as a seed to explore sex differences in maturational coupling because it is where rate of cortical thickness (CT) change shows statistically significant sex differences over the age range studied—in both prior work (Raznahan et al., 2010; Figure S4A) and our current study (Figure S4B). (A) Map of regions showing significant maturational coupling with left FPC that is not significantly different in magnitude between males and females. Note the very strong relationship between left FPC change and change at its contralateral homolog. Several regions show bilateral coupling with IFPC change (e.g., inferior temporal, planum temporale, angular gyrus and orbitofrontal cortex). (B) Regions where coupling with IFPC CT change differs significantly between males and females. These consist of areas where coupling is specific to females, as shown for the right dorsolateral prefrontal cortex (rDLPFC) in the inset scatter plot. Furthermore, sex differences in FPC-DLPFC coupling also remained statistically significant after removal of nine outliers (defined using a conservative Cooks distance threshold of 4/n).

References

    1. Andrews-Hanna JR, Reidler JS, Sepulcre J, Poulin R, Buckner RL. Functional-anatomic fractionation of the brain’s default network. Neuron. 2010;65:550–562. - PMC - PubMed
    1. Badre D, Wagner AD. Selection, integration, and conflict monitoring; assessing the nature and generality of prefrontal cognitive control mechanisms. Neuron. 2004;41:473–487. - PubMed
    1. Barton RA, Harvey PH. Mosaic evolution of brain structure in mammals. Nature. 2000;405:1055–1058. - PubMed
    1. Buckner RL, Andrews-Hanna JR, Schacter DL. The brain’s default network: anatomy, function, and relevance to disease. Ann N Y Acad Sci. 2008;1124:1–38. - PubMed
    1. Bullmore E, Sporns O. Complex brain networks: graph theoretical analysis of structural and functional systems. Nat Rev Neurosci. 2009;10:186–198. - PubMed

Publication types