. 2012 Feb;6(1):48-61.
doi: 10.1016/j.molonc.2011.11.004. Epub 2011 Nov 25.

CRABP-II methylation: a critical determinant of retinoic acid resistance of medulloblastoma cells

Affiliations

CRABP-II methylation: a critical determinant of retinoic acid resistance of medulloblastoma cells

Yuan-Shan Fu et al. Mol Oncol. 2012 Feb.

Abstract

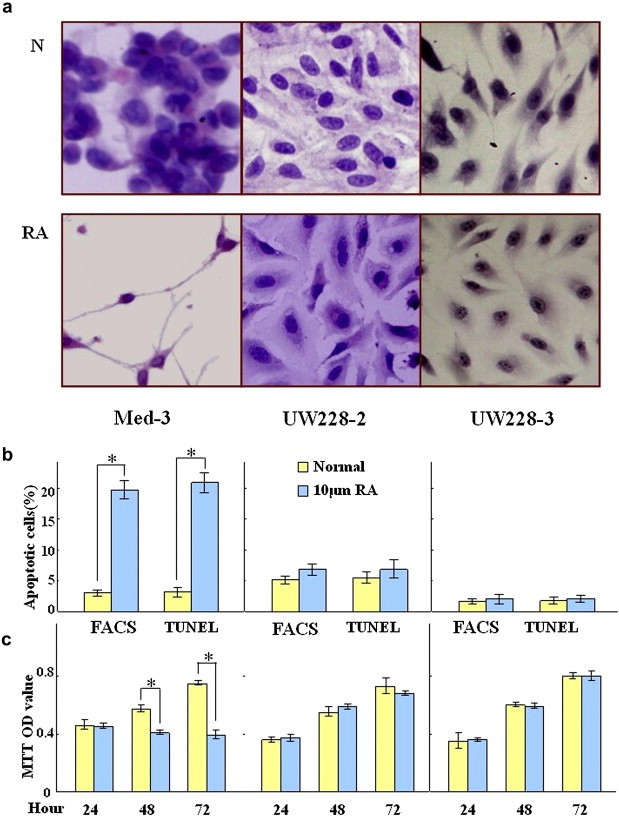
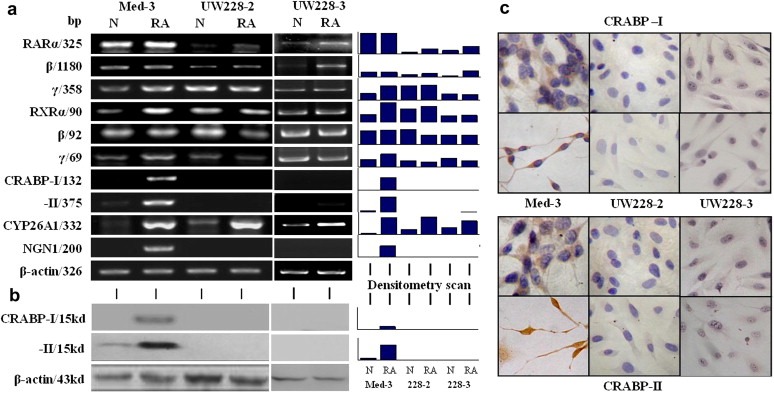
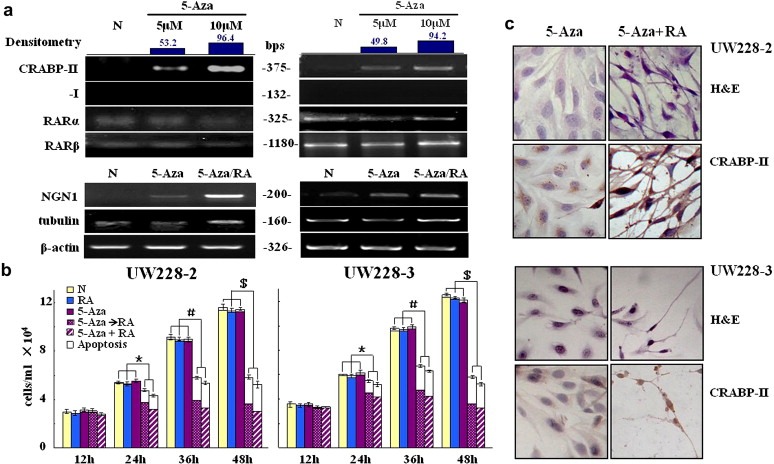
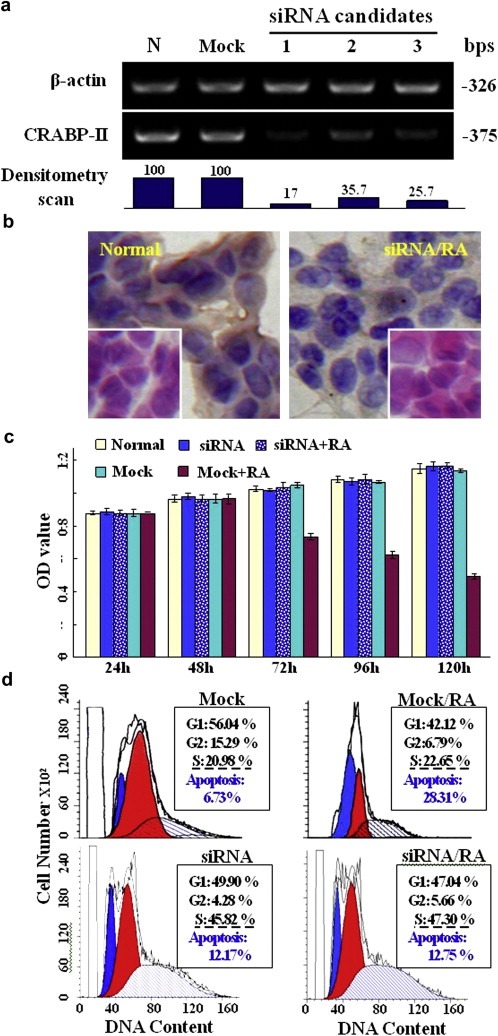
Medulloblastoma cells exhibit varied responses to therapy by all-trans retinoic acid (RA). The underlying mechanism for such diverse effects however remains largely unclear. In this study, we attempted to elucidate the molecular basis of RA resistance through the study of RA signaling components in both RA-sensitive (Med-3) and RA-resistant (UW228-2 and UW228-3) medulloblastoma cells. The results revealed that RARα/β/γ and RXRα/β/γ were found in the three cell lines. Expression of CRABP-I and CRABP-II was seen in Med-3 cells, up-regulated when treated with RA, but was absent in UW228-2 and UW228-3 cells regardless of RA treatment. Bisulfite sequencing revealed 8 methylated CG sites at the promoter region of CRABP-II in UW228-2 and UW228-3 but not in Med-3 cells. Demethylation by 5-aza-2'-deoxycytidine recovered CRABP-II expression. Upon restoration of CRABP-II expression, both UW228-2 and UW228-3 cells responded to RA treatment by forming neuronal-like differentiation, synaptophysin expression, β-III tubulin upregulation, and apoptosis. Furthermore, CRABP-II specific siRNA reduced RA sensitivity in Med-3 cells. Tissue microarray-based immunohistochemical staining showed variable CRABP-II expression patterns among 104 medulloblastoma cases, ranging from negative (42.3%), partly positive (14.4%) to positive (43.3%). CRABP-II expression was positively correlated with synaptophysin (rs = 0.317; p = 0.001) but not with CRABP-I expression (p > 0.05). In conclusion, aberrant methylation in CRABP-II reduces the expression of CRABP-II that in turn confers RA resistance in medulloblastoma cells. Determination of CRABP-II expression or methylation status may enable a personalized RA therapy in patients with medulloblastomas and other types of cancers.


Figures

Figure 1
Figure 1
H&E morphological staining (a), flow cytometry (b), TUNEL (b) and MTT assay (c) performed on Med‐3, UW228‐2 and UW228‐3 cells under normal culture condition (N) and incubated with 10 μM RA for 3 days (RA). * indicates p < 0.01.
Figure 2
Figure 2
Evaluation of the expression of RA signaling components (RARα, RARβ, RARγ, RXRα, RXRβ, RXRγ, CRABP‐I, CRABP‐II and CYP26A1) and neuronal differentiation biomarker NGN1 in Med‐3, UW228‐2 and UW228‐3 cells by RT‐PCR (a), followed by Western blotting (b) and ICC staining (c) for CRABP‐I and ‐II. Grayscale quantitative analysis was performed on the RT‐PCR and Western blot results. N, normal culture; RA, treatment with 10 μM RA for 72 h.
Figure 3
Figure 3
BSP sequencing‐based DNA methylation analyses of CRABP‐II promoter region encompassing the position of −734 to −521 and 8 CG sites. The sample DNAs isolated from UW228‐2 and UW228‐3 cells were positive in methylation. The methylation status in Med‐3 cells was determined as the negative control. a. Scheme of CRABP‐II gene and the location of BSP amplified promoter region. b. The nucleotide sequence of BSP product and the locations of 8 CG sites. c. The sequencing result of the underlined region (b) of CRABP‐II BSP product generated from UW228‐2 and Med‐3 sample DNAs, respectively. The sequencing result of UW228‐3 BSP product is the same as that of UW228‐2 product and therefore not shown.
Figure 4
Figure 4
Effects of 5‐aza‐2′‐deoxycytidine induced demethylation on gene expression and RA sensitivity of UW228‐2 and −3 cells. a. RT‐PCR examination of CRABP‐II, CRABP‐I, RARα and RARβ transcription after 4‐day demethylation treatments with 5 μM and 10 μM 5‐aza‐2′‐deoxycytidine. b. Total cell numbers and viable fractions of UW228‐2 and −3 cells cultured for 2 days under the following conditions: 1, normal culture; 2, 10 μM RA; 3, 10 μM 5‐aza‐2′‐deoxycytidine; 4, 10 μM RA after 10 μM 5‐aza‐2′‐deoxycytidine pre‐treatment and 5, co‐treatment with 10 μM 5‐aza‐2′‐deoxycytidine and 10 μM RA. White block, nonviable cells; gray block, viable cells. *, # and $ indicate p < 0.01, respectively. c. Morphological features (H&E staining; X40) and immunocytochemical illustration of CRABP‐II expression of UW228‐2 and −3 cells treated by 10 μM 5‐aza‐2′‐deoxycytidine and by 10 μM 5‐aza‐2′‐deoxycytidine and 10 μM RA combination. RT‐PCR was performed to examine NGN1 transcription in normally cultured cells (N), 3 day 10 μM 5‐aza‐2′‐deoxycytidine treated cells (5‐aza) and the cells pre‐treated by 10 μM 5‐aza‐2′‐deoxycytidine for 3 days, followed by 2 day 10 μM RA treatment (5‐aza+RA).
Figure 5
Figure 5
a. H/E morphological staining, CRABP‐II oriented immunocytochemical staining and TUNEL assay performed on UW228‐2 cells transfected with CRABP‐II expressing plasmids and cultured without (Transfection only) or with 10 μM RA supplementation (Transfection/RA). b. Trypan blue viable/nonviable cell discrimination performed on UW228‐2 cells under six experimental conditions: N. normal culture; RA, 10 mM RA treatment; Lipo2000, treatment with transfection reagent only; Lipo2000/RA, co‐treatment with transfection reagent and 10 μM RA; Transfection, CRABP‐II siRNA transfection; Transfection/RA, co‐treatment with CRABP‐II siRNA and 10 μM RA. *, indicates p < 0.01.
Figure 6
Figure 6
siRNA suppressed CRABP‐II expression and its influence in RA sensitivity of Med‐3 cells. a. Down‐regulation of CRABP‐II expression by siRNA and subsequent reduction of RA sensitivity of Med‐3 cells. Densitometry scan values of the RT‐PCR products showed that the three siRNA candidates exerted different inhibitory effects on CRABP‐II transcripts. b. H&E staining C and RABP‐II oriented immunocytochemical staining performed on normally cultured Med‐3 cells and the cells treated by siRNA and RA combination. c. MTT‐based proliferation assay of Med‐3 cells under normal culture condition (normal), transfected with mock siRNA (mock) or with CRABP‐II specific siRNA (siRNA) and pre‐treated by CRABP‐II specific siRNA for 48 h, followed by 10 μM RA supplementation (siRNA + RA). No statistical significance of OD values among the four experimental groups (p > 0.05). d. Flow cytometry analysis of Med‐3 cells under four culture conditions: mock, transfected with mock siRNA; siRNA, transfected with CRABP‐II specific siRNA; mock + RA, treated by mock siRNA for 48 h and then 10 μM RA for 72 h; siRNA + RA, treated by CRABP‐II specific siRNA for 48 h and then 10 μM RA for 72 h.
Figure 7
Figure 7
a. Immunohistochemical illustration of CRABP‐I, CRABP‐II and synaptophysin expression in medulloblastoma‐surrounding non‐cancerous tissues. b. Immunohistochemical profiling of CRABP‐II expression patterns in the classic and the anaplastic subtypes of medulloblastomas. The staining patterns were scored as “Negative (−)” if no immunolabeling was observed in the tumor cells, “Positive (+)” if distinct staining was generally observed and “Mixed (+/−)” when CRABP‐II positive and negative tumor cells co‐existed in the same observed region. c. The incidences of three CRABP‐I IHC staining patterns in the medulloblastoma subtypes. d. Fractionation of CRABP‐I and CRABP‐II expression patterns in the three medulloblastoma subtypes. Chi‐square analysis showed no statistic difference between the expression of these two genes in any of the histological groups (p > 0.05).

References

    1. Abu-Abed, S. , MacLean, G. , Fraulob, V. , Chambon, P. , Petkovich, M. , Dollé, P. , 2002. Differential expression of the retinoic acid-metabolizing enzymes CYP26A1 and CYP26B1 during murine organogenesis. Mech. Dev.. 110, 173–177. - PubMed
    1. Aström, A. , Tavakkol, A. , Pettersson, U. , Cromie, M. , Elder, J.T. , Voorhees, J.J. , 1991. Molecular cloning of two human cellular retinoic acid-binding proteins (CRABP). Retinoic acid-induced expression of CRABP-II but not CRABP-I in adult human skin in vivo and in skin fibroblasts in vitro. J. Biol. Chem.. 266, 17662–17666. - PubMed
    1. Bergamaschi, D. , Gasco, M. , Hiller, L. , Sullivan, A. , Syed, N. , Trigiante, G. , Yulug, I. , Merlano, M. , Numico, G. , Comino, A. , Attard, M. , Reelfs, O. , 2003. P53 polymorphism influences response in cancer chemotherapy via modulation of p73-dependent apoptosis. Cancer Cell.. 3, 387–402. - PubMed
    1. Budhu, A.S. , Noy, N. , 2002. Direct channeling of retinoic acid between cellular retinoic acid-binding protein II and retinoic acid receptor sensitizes mammary carcinoma cells to retinoic acid-induced growth arrest. Mol. Cell Biol.. 22, 2632–2641. - PMC - PubMed
    1. Calmon, M.F. , Rodrigues, R.V. , Kaneto, C.M. , Moura, R.P. , Silva, S.D. , Mota, L.D. , Pinheiro, D.G. , Torres, C. , de Carvalho, A.F. , Cury, P.M. , Nunes, F.D. , Nishimoto, I.N. , 2009. Epigenetic silencing of CRABP2 and MX1 in Head and Neck tumors. Neoplasia. 11, 1329–1339. - PMC - PubMed

Publication types

MeSH terms

Substances