. 2012 Mar;316(1):46-52.
doi: 10.1016/j.canlet.2011.10.019. Epub 2011 Oct 20.

Characterization of two mouse models of metastatic pheochromocytoma using bioluminescence imaging

Affiliations

Characterization of two mouse models of metastatic pheochromocytoma using bioluminescence imaging

Alessio Giubellino et al. Cancer Lett. 2012 Mar.

Abstract

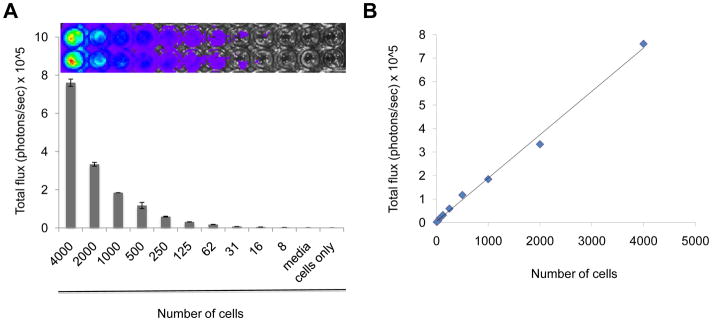
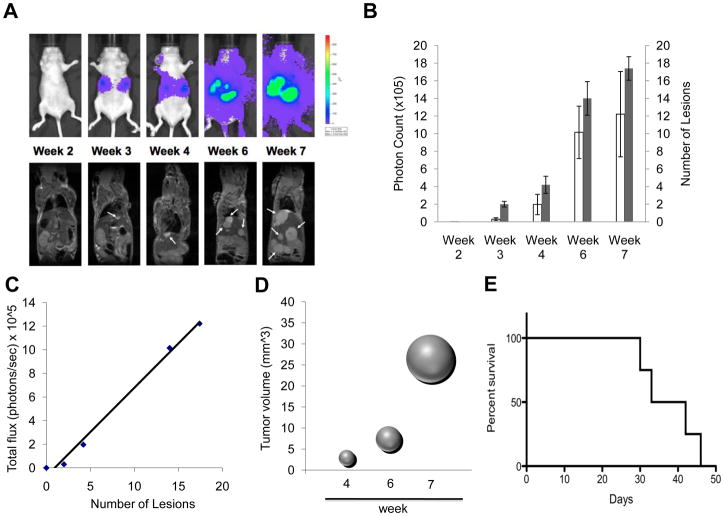
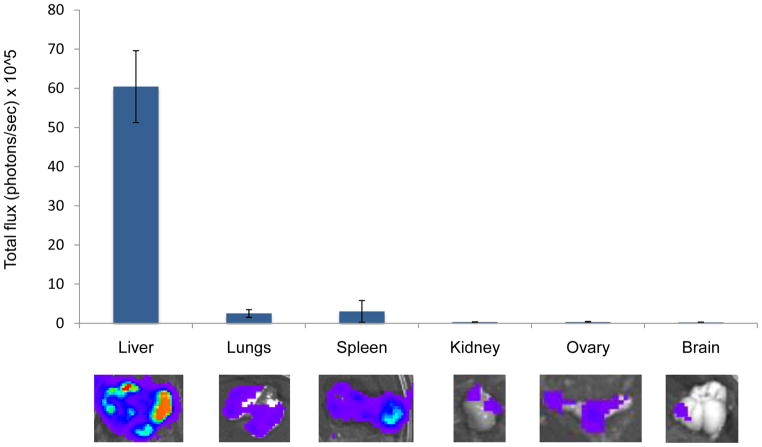
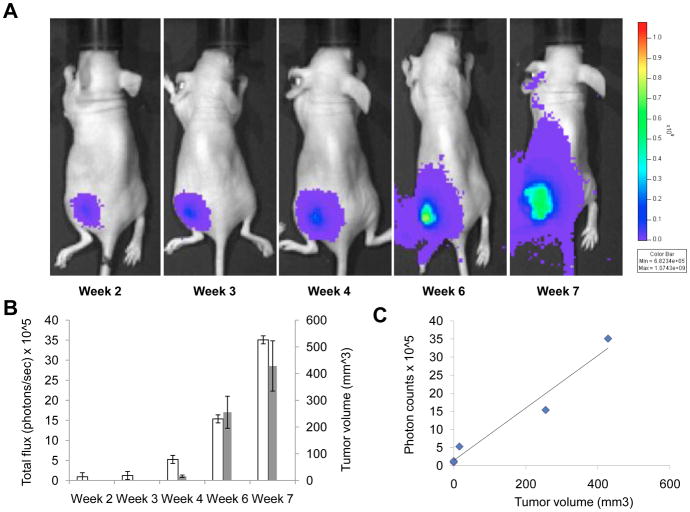
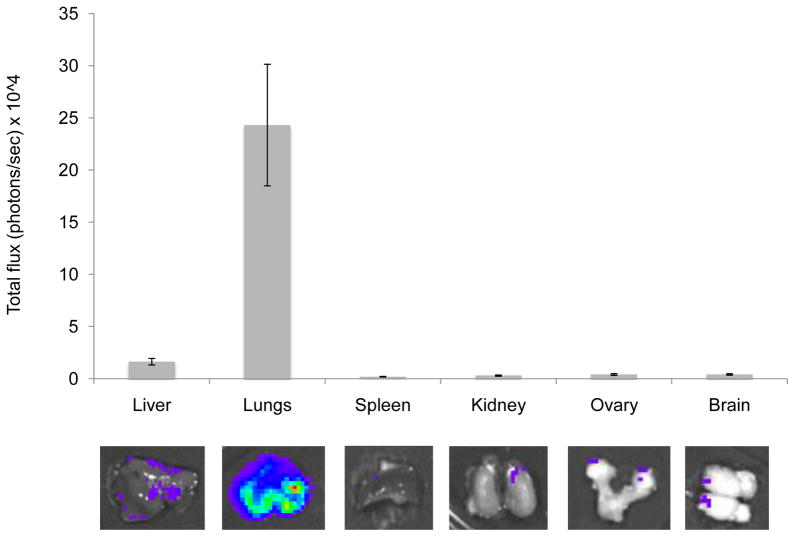
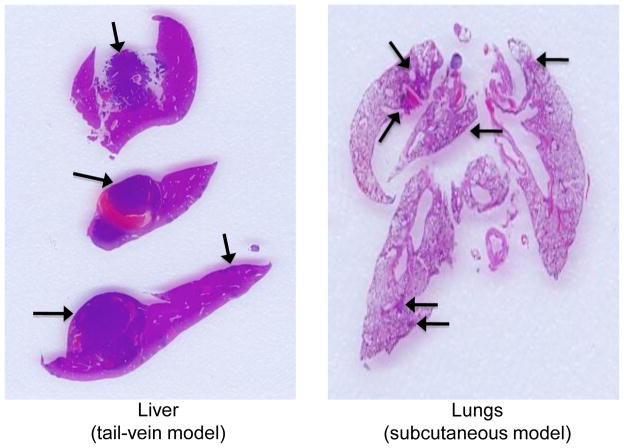
Pheochromocytoma is the most common tumor of the adrenal medulla in adults. The lack of sensitive animal models of pheochromocytoma has hindered the study of this tumor and in vivo evaluation of antitumor agents. In this study we generated two sensitive luciferase models using bioluminescent pheochromocytoma cells: an experimental metastasis model to monitor tumor spreading and a subcutaneous model to monitor tumor growth and spontaneous metastasis. These models offer a platform for sensitive, non-invasive and real-time monitoring of pheochromocytoma primary growth and metastatic burden to follow the course of tumor progression and for testing relevant antitumor treatments in metastatic pheochromocytoma.


Conflict of interest statement

Conflict-of-interest disclosure

The authors declare no competing financial interests.

Figures

Figure 1
Figure 1
(A) Bioluminescence signal of the murine pheochromocytoma MTT-luc cells in vitro. MTT-luc cells were diluted from 4,000 to 8 cells, plated in duplicate in a 96 well plate and imaged for 20 seconds after addition of luciferin to the media. Media alone (Media; luciferin added) and 4,000 cells (Cells only; no luciferin) were used as negative controls. (B) Correlation plot of photon counts vs. number of plated cells (R2 = 0.99)
Figure 2
Figure 2
Kinetics of tumor cell growth by Bioluminescence and MRI signals in vivo in an experimental metastasis model. MTT-cells (5 × 10⁵) were injected via tail vein into nude mice (n= 6). Images were taken weekly for 7 weeks. (A) Representative images are shown of the same mouse by bioluminescence detection (upper row) and MRI scanning (lower row). Arrows indicate some of the tumor lesions as evidenced by MRI imaging. (B) Quantification of tumor signal over time is represented as mean photon counts (total flux) compared with quantification of number of lesions counted on the MRI images s represented as mean; error bars represent standard error of the mean. In MRI the lesions were counted and measured using OsiriX software. (C) Correlation plot of photon counts vs. number of lesions (R2 = 0.99). (D) Bubble plot representation of metastatic tumor progression as spheres calculated from averaged tumor mass diameters measured by MRI imaging. (E) Kaplan-Meier plot illustrating animal survival following intravenous injection of tumor cells.
Figure 3
Figure 3
Ex vivo analysis of organ metastasis by bioluminescence in the experimental metastasis model. Fifteen minutes after luciferin injection, the animals were euthanized and internal organs analyzed for bioluminescence signals. Representative images of internal organs are shown (lower panel); photons/sec emitted by each organ were averaged and are represented in the upper panel, including standard deviations.
Figure 4
Figure 4
Longitudinal subcutaneous tumor monitoring. MTT-luc (1 × 10⁶ cells) cells were injected subcutaneously in the left flank of Nude mice (n= 6). (A). Representative images from the same mouse and taken weekly after implantation, are presented. (B) Tumor growth was monitored and quantified (as photon/sec) weekly by BLI, together with tumor volume here represented as average per week; error bars indicate standard error of the mean. (C) Correlation plot of photon counts vs. tumor volume (R2 = 0.99)
Figure 5
Figure 5
Ex vivo analysis of organ metastasis by bioluminescence in the spontaneous metastsis model. Fifteen minutes after luciferin injection, the animals were euthanized and internal organs analyzed for bioluminescence signals. Representative images of internal organs are shown (lower panel); photons/sec emitted by each organ were averaged and are represented in the upper panel, including standard deviations.
Figure 6
Figure 6
Histopathological analysis in metastatic sites. Representative histological sections of liver and lung metastasis from MTT-luc cells. The presence of metastatic tumor cells initially detected in vivo and ex vivo by BLI imaging was confirmed by histopathological analysis. Metastatic sites are indicated by the arrows.

References

    1. Jemal A, Bray F, Center MM, Ferlay J, Ward E, Forman D. Global cancer statistics. CA Cancer J Clin. 2011;61:69–90. - PubMed
    1. Kantorovich V, King KS, Pacak K. SDH-related pheochromocytoma and paraganglioma. Best Pract Res Clin Endocrinol Metab. 2010;24:415–424. - PMC - PubMed
    1. Goldstein RE, O’Neill JA, Jr, Holcomb GW, 3rd, Morgan WM, 3rd, Neblett WW, 3rd, Oates JA, Brown N, Nadeau J, Smith B, Page DL, Abumrad NN, Scott HW., Jr Clinical experience over 48 years with pheochromocytoma. Ann Surg. 1999;229:755–764. discussion 764–756. - PMC - PubMed
    1. John H, Ziegler WH, Hauri D, Jaeger P. Pheochromocytomas: can malignant potential be predicted? Urology. 1999;53:679–683. - PubMed
    1. Lehnert H, Mundschenk J, Hahn K. Malignant pheochromocytoma. Front Horm Res. 2004;31:155–162. - PubMed

Publication types

MeSH terms