

Somatosensory activation of two fingers can be discriminated with ultrahigh-density diffuse optical tomography
- PMID: 22155031
- PMCID: PMC3288812
- DOI: 10.1016/j.neuroimage.2011.11.062
Somatosensory activation of two fingers can be discriminated with ultrahigh-density diffuse optical tomography
Abstract
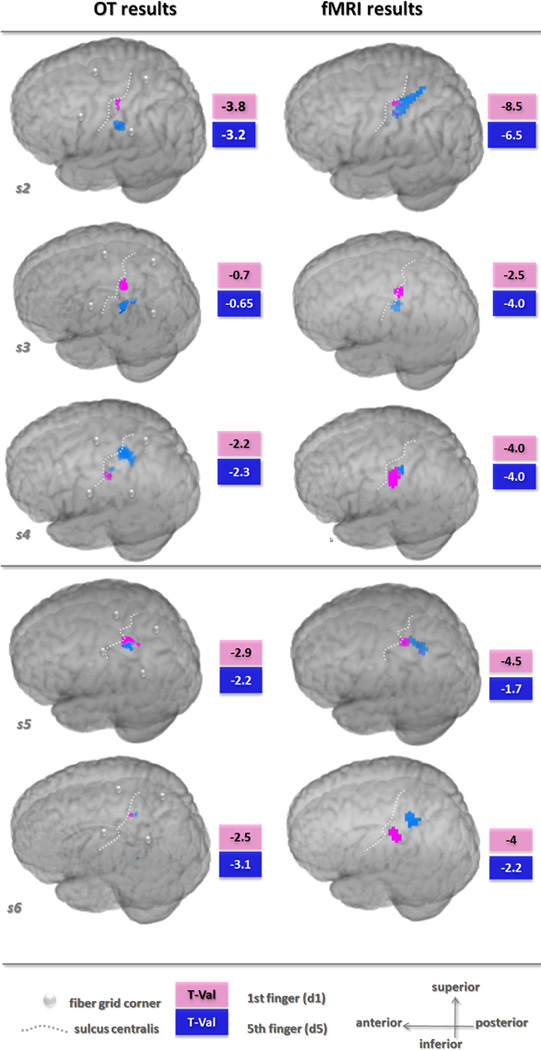
Topographic non-invasive near infrared spectroscopy (NIRS) has become a well-established tool for functional brain imaging. Applying up to 100 optodes over the head of a subject, allows achieving a spatial resolution in the centimeter range. This resolution is poor compared to other functional imaging tools. However, recently it was shown that diffuse optical tomography (DOT) as an extension of NIRS based on high-density (HD) probe arrays and supplemented by an advanced image reconstruction procedure allows describing activation patterns with a spatial resolution in the millimeter range. Building on these findings, we hypothesize that HD-DOT may render very focal activations accessible which would be missed by the traditionally used sparse arrays. We examined activation patterns in the primary somatosensory cortex, since its somatotopic organization is very fine-grained. We performed a vibrotactile stimulation study of the first and fifth finger in eight human subjects, using a 900-channel continuous-wave DOT imaging system for achieving a higher resolution than conventional topographic NIRS. To compare the results to a well-established high-resolution imaging technique, the same paradigm was investigated in the same subjects by means of functional magnetic resonance imaging (fMRI). In this work, we tested the advantage of ultrahigh-density probe arrays and show that highly focal activations would be missed by classical next-nearest neighbor NIRS approach, but also by DOT, when using a sparse probe array. Distinct activation patterns for both fingers correlated well with the expected neuroanatomy in five of eight subjects. Additionally we show that activation for different fingers is projected to different tissue depths in the DOT image. Comparison to the fMRI data yielded similar activation foci in seven out of ten finger representations in these five subjects when comparing the lateral localization of DOT and fMRI results.
Copyright © 2011 Elsevier Inc. All rights reserved.
Figures


References
-
- Arridge SR, Hebden JC. Optical imaging in medicine: II. Modelling and reconstruction. Phys Med Biol. 1997;42:841–853. - PubMed
-
- Ashburner J, Barnes G, Chen C, Daunizeau J, Flandin G, Friston K, Gitelman D, Kiebel S, Kilner J, Litvak V, Moran R, Penny W, Stephan K, Gitelman D, Henson R, Hutton C, Glauche V, Mattout J, Phillips C. SPM8 Manual. London, UK: 2011.
-
- Barbour RL, Graber HL, Pei Y, Zhong S, Schmitz CH. Optical tomographic imaging of dynamic features of dense-scattering media. J Opt Soc Am A Opt Image Sci Vis. 2001;18:3018–3036. - PubMed
-
- Bluestone A, Abdoulaev G, Schmitz C, Barbour R, Hielscher A. Three-dimensional optical tomography of hemodynamics in the human head. Opt Express. 2001;9:272–286. - PubMed
Publication types
MeSH terms
Grants and funding
LinkOut - more resources
Full Text Sources
Other Literature Sources
Medical
