. 2012 Feb 15;59(4):3563-70.
doi: 10.1016/j.neuroimage.2011.11.046. Epub 2011 Nov 28.

Individualized localization and cortical surface-based registration of intracranial electrodes

Affiliations

Individualized localization and cortical surface-based registration of intracranial electrodes

Andrew R Dykstra et al. Neuroimage. .

Abstract

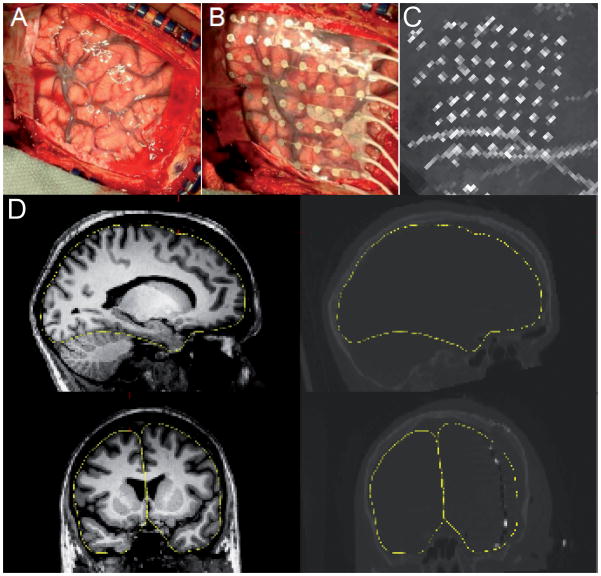
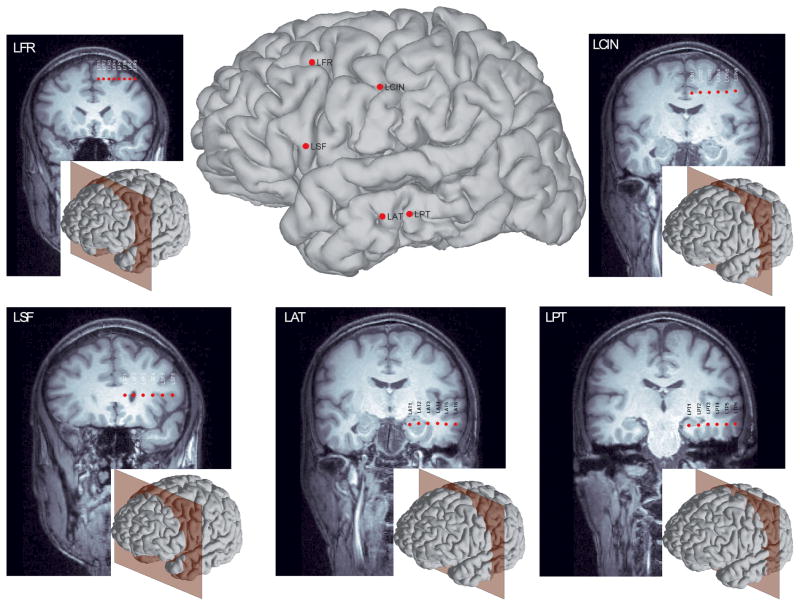
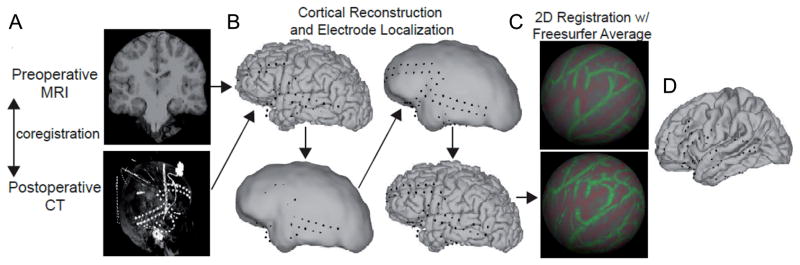
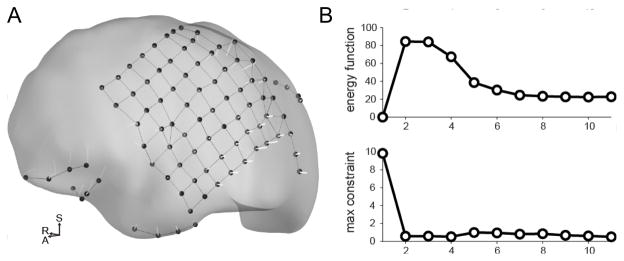
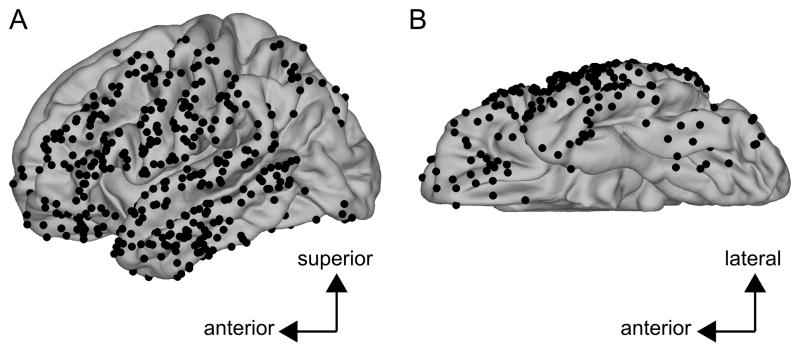
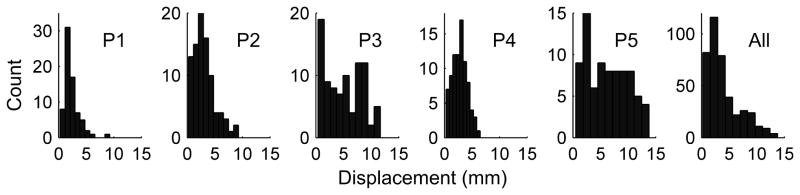
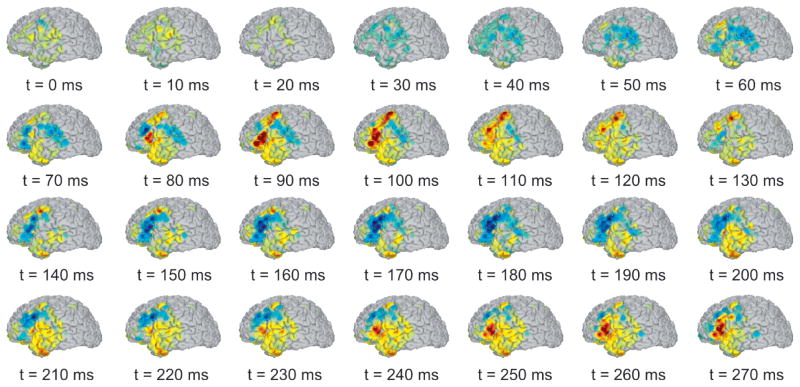
In addition to its widespread clinical use, the intracranial electroencephalogram (iEEG) is increasingly being employed as a tool to map the neural correlates of normal cognitive function as well as for developing neuroprosthetics. Despite recent advances, and unlike other established brain-mapping modalities (e.g. functional MRI, magneto- and electroencephalography), registering the iEEG with respect to neuroanatomy in individuals-and coregistering functional results across subjects-remains a significant challenge. Here we describe a method which coregisters high-resolution preoperative MRI with postoperative computerized tomography (CT) for the purpose of individualized functional mapping of both normal and pathological (e.g., interictal discharges and seizures) brain activity. Our method accurately (within 3mm, on average) localizes electrodes with respect to an individual's neuroanatomy. Furthermore, we outline a principled procedure for either volumetric or surface-based group analyses. We demonstrate our method in five patients with medically-intractable epilepsy undergoing invasive monitoring of the seizure focus prior to its surgical removal. The straight-forward application of this procedure to all types of intracranial electrodes, robustness to deformations in both skull and brain, and the ability to compare electrode locations across groups of patients makes this procedure an important tool for basic scientists as well as clinicians.


Figures

Figure 1
Figure 1. Intraoperative photographs, MRI-CT coregistration, and maximal-intensity projection
(A) Reflected dura, exposed pial surface and overlaid electrode array (B) from a typical craniotomy. (C) The sagittal maximal-intensity projection of the postoperative CT scan, showing most of the electrode sites in a single view. (D) Illustration of the accuracy of the coregistration between the preoperative MRI and the postoperative CT. The left panels show sagittal (top) and coronal (bottom) views of a single subject’s (patient 5) MRI; the right panels show the same orientations for the postoperative CT. Electrode sites can be seen as bright spots in the coronal CT section. The yellow trace outlines the pial surface in both the MRI and CT.
Figure 2
Figure 2
Slice views of five arrays of depth electrodes after reslicing the 3D MRI volume to the long axis of each array. The middle panel shows the entry point for each array overlaid on the reconstructed cortical surface; the inset in each panel shows this patient’s reconstructed cortical surface along with peri-coronally oriented planes to indicate the slice view.
Figure 3
Figure 3. Outline of electrode localization and intersubject mapping procedure
(A) The preoperative MRI is coregistered with the postoperative CT volume. The lower panel shows the maximal intensity projection of the CT volume in the sagittal dimension, which shows all the electrodes in a sagittal plane. (B) Due to the parenchymal shift from the implant procedure, some electrodes initially appear as though buried in the gray matter. To correct for this, each electrode coordinate is projected first to a smoothed pial surface (effectively a dural surface) and subsequently back to the pial surface. (C) 2D registration with the Freesurfer average brain. An inflated spherical surface is computed from the individual’s pial surface and aligned with that of the Freesurfer average. (D) Projection of each electrode coordinate from the individual’s pial surface to that of the Freesurfer average.
Figure 4
Figure 4. Illustration of the energy-minimization procedure used to project the electrode coordinates onto the cortical surface
(A) Dural surface showing each electrode’s path from it’s initial volumetric location estimate to it’s final location on the dural surface. (B) The top panel shows the value of the energy function across successive iterations of the algorithm. Note how the function approaches a stable value as the number of iterations increases. The bottom panel shows the value of the constraint function.
Figure 5
Figure 5. Electrode coordinates collapsed across all four patients mapped onto the Freesurfer average brain
Each black dot represents an electrode from one of the four patients. (A) Lateral view of the left hemisphere. (B) Inferior view of the left hemisphere.
Figure 6
Figure 6
Histograms of distances between initial and final (i.e. after “snapping) estimates of electrode locations yielding a measure of intracranial pressure-induced parenchyma deformation due to electrode implantation. Each of the first five panels shows the distance histograms from single patients; the right-most panel shows the distance histogram across all five patients.
Figure 7
Figure 7
Spatiotemporal voltage map of an interictal discharge from patient 5. Color intensity indicates amplitude of positive (red) or negative (blue) voltage. The discharge initiates near the border of the middle and inferior frontal gyri at approximately 70ms into the epoched time window. A post-discharge undershoot can be seen beginning around 130ms and continuing until the start of the slow wave 230ms.

References

    1. Bootsveld K, et al. Localisation of intracranial EEG electrodes using three dimensional surface reconstructions of the brain. [Accessed September 27, 2010];European Radiology. 1994 4(1) Available at: http://www.springerlink.com/content/wq4t753481u36412/
    1. Brugge JF, et al. Functional localization of auditory cortical fields of human: click-train stimulation. Hearing Research. 2008;238(1–2):12–24. - PMC - PubMed
    1. Canolty RT, et al. High gamma power is phase-locked to theta oscillations in human neocortex. Science (New York, NY) 2006;313(5793):1626–1628. - PMC - PubMed
    1. Cash SS, et al. The human K-complex represents an isolated cortical down-state. Science (New York, NY) 2009;324(5930):1084–1087. - PMC - PubMed
    1. Collins DL, et al. Automatic 3D intersubject registration of MR volumetric data in standardized Talairach space. Journal of Computer Assisted Tomography. 1994;18(2):192–205. - PubMed