. 2012 Jan 15;258(2):288-95.
doi: 10.1016/j.taap.2011.11.008. Epub 2011 Nov 23.

Di (2-ethylhexyl) phthalate inhibits growth of mouse ovarian antral follicles through an oxidative stress pathway

Affiliations

Di (2-ethylhexyl) phthalate inhibits growth of mouse ovarian antral follicles through an oxidative stress pathway

Wei Wang et al. Toxicol Appl Pharmacol. .

Abstract

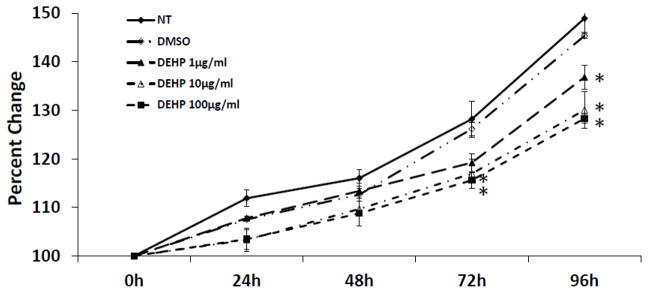
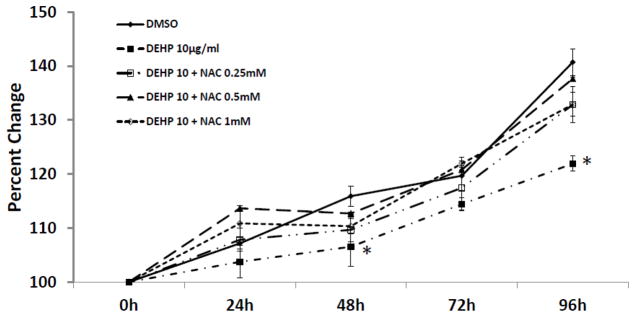
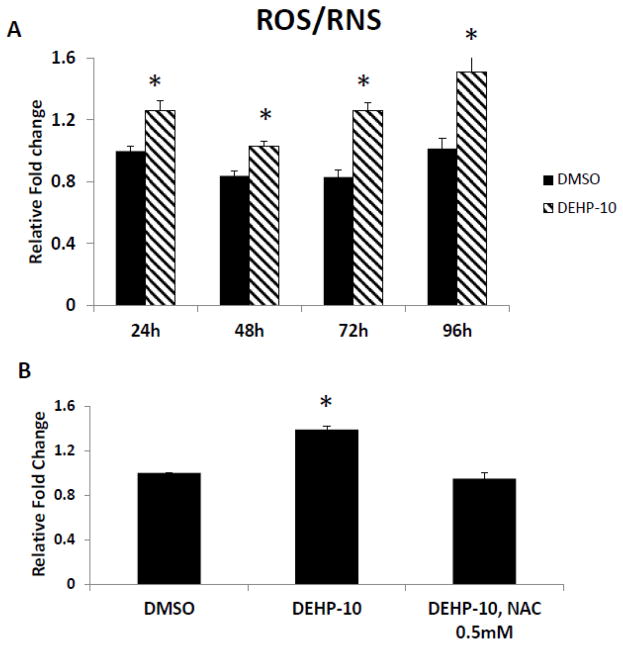
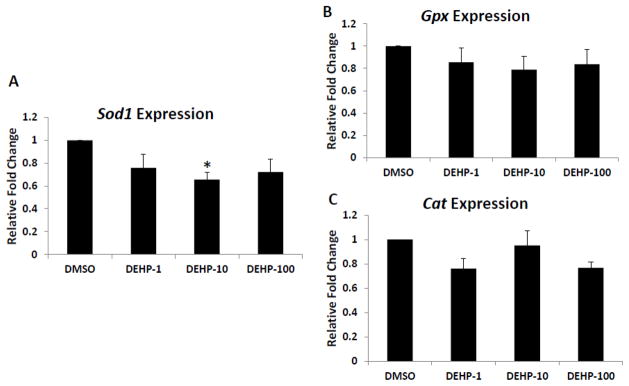
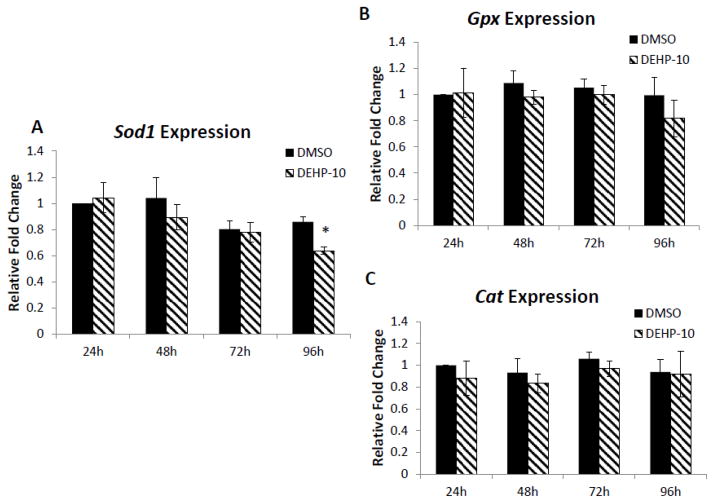
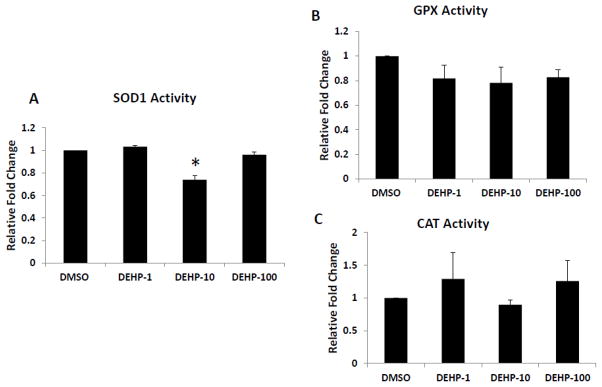
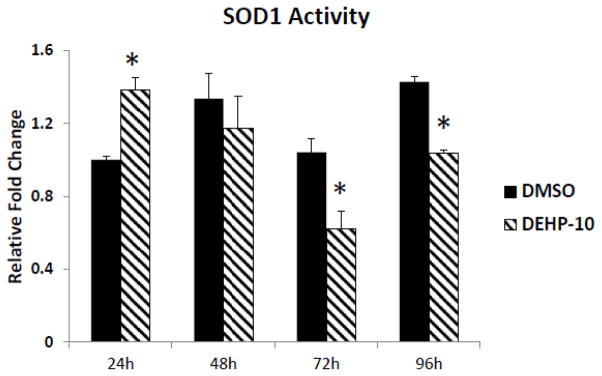
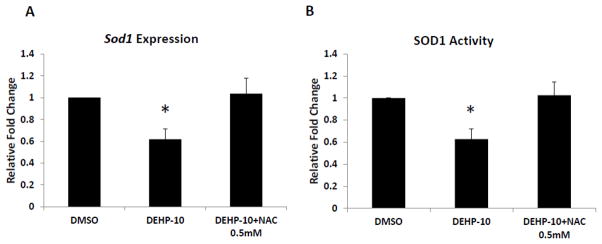
Di (2-ethylhexyl) phthalate (DEHP) is a plasticizer that has been shown to inhibit growth of mouse antral follicles, however, little is known about the mechanisms by which DEHP does so. Oxidative stress has been linked to follicle growth inhibition as well as phthalate-induced toxicity in non-ovarian tissues. Thus, we hypothesized that DEHP causes oxidative stress and that this leads to inhibition of the growth of antral follicles. To test this hypothesis, antral follicles isolated from CD-1 mice (age 31-35days) were cultured with vehicle control (dimethylsulfoxide [DMSO]) or DEHP (1-100μg/ml)±N-acetyl cysteine (NAC, an antioxidant at 0.25-1mM). During culture, follicles were measured daily. At the end of culture, follicles were collected and processed for in vitro reactive oxygen species (ROS) assays to measure the presence of free radicals or for measurement of the expression and activity of various key antioxidant enzymes: Cu/Zn superoxide dismutase (SOD1), glutathione peroxidase (GPX) and catalase (CAT). The results indicate that DEHP inhibits the growth of follicles compared to DMSO control and that NAC (0.25-1mM) blocks the ability of DEHP to inhibit follicle growth. Furthermore, DEHP (10μg/ml) significantly increases ROS levels and reduces the expression and activity of SOD1 compared to DMSO controls, whereas NAC (0.5mM) rescues the effects of DEHP on ROS levels and SOD1. However, the expression and activity of GPX and CAT were not affected by DEHP treatment. Collectively, these data suggest that DEHP inhibits follicle growth by inducing production of ROS and by decreasing the expression and activity of SOD1.


Conflict of interest statement

Conflict of interest statement

The authors have no conflicts to disclose.

Figures

Fig. 1
Fig. 1. Effect of DEHP exposure on antral follicle growth
Antral follicles were cultured in the presence of DMSO or DEHP (1–100μg/ml) for 96h. Growth of follicles was monitored during culture and reported as percent change over time. The graph represents means ± SEMs from at least three separate experiments. Lines with asterisks (*) are significantly different from DMSO controls at 72h and 96h time points (n=10–16 follicles per treatment per experiment; p≤ 0.05).
Fig. 2
Fig. 2. Effect of DEHP and NAC co-treatment on antral follicle growth
Antral follicles were cultured in the presence of DMSO or DEHP (10μg/ml) ± NAC (0.25–1mM) for 96h. Growth of follicles was monitored during culture and reported as percent change over time. The graph represents means ± SEMs from at least three separate experiments. The line with asterisks (*) is significantly different from DMSO controls at 48h and 96h time points (n=10–16 follicles per treatment per experiment; p≤ 0.05).
Fig. 3
Fig. 3. Effect of DEHP and NAC on ROS/RNS levels in antral follicles
A. Antral follicles were exposed in vitro to DMSO or DEHP (10 μg/ml) for 24, 48, 72 and 96h and subjected to ROS/RNS assays to measure ROS/RNS levels. The level of ROS/RNS was normalized to protein level in each sample and reported as relative fold change compared to 24h DMSO controls. Asterisk (*) indicates a significant p value from DMSO controls at the same time point via ANOVA, post hoc Tukey’s HSD (p≤ 0.05). B. After exposure of antral follicles to DMSO or DEHP (10 μg/ml) ± NAC (0.5mM) for 96h, follicles were collected and subjected to in vitro ROS/RNS assay to measure the ROS/RNS levels. The level of ROS/RNS was normalized by protein level in each sample and reported as relative fold change compared to DMSO controls. Asterisk (*) indicates significant difference (p≤0.05) from DMSO controls via ANOVA, followed by post hoc Tukey’s HSD. All data represent mean ± SEM from 3 independent experiments (35 follicles per treatment per experiment).
Fig. 4
Fig. 4. Effect of DEHP exposure on Sod1, Gpx and Cat mRNA expression levels
After exposure of antral follicles to DMSO or DEHP (1–100μg/ml) for 96h in vitro, the follicles were collected and subjected to real-time PCR analysis for Sod1, Gpx and Cat mRNA expression levels. All values were normalized to β-actin as a loading control and reported as relative fold change compared to DMSO controls. Graph represents means ± SEMs from at least three separate experiments. Asterisk (*) indicates a significant difference from the DMSO control via ANOVA followed by Tukey’s HSD post hoc test (n=10–16 follicles per treatment per experiment; p≤ 0.05).
Fig. 5
Fig. 5. Effect of DEHP exposure on expression of Sod1, Gpx and Cat in antral follicles over time
Antral follicles were exposed in vitro to DMSO or DEHP (10μg/ml) for 24, 48, 72 and 96h and subjected to real-time PCR for analysis of Sod1, Gpx and Cat mRNA levels. All values were normalized to β-actin as a loading control and reported as relative fold change compared to DMSO controls at 24h. Graph represents means ± SEMs from at least three separate experiments. Asterisk (*) indicates a significant difference from DMSO controls at 24h via ANOVA followed by Tukey’s HSD post hoc test (n=10–16 follicles per treatment per experiment; p≤ 0.05).
Fig. 6
Fig. 6. Effect of DEHP exposure on SOD1, GPX and CAT activities in antral follicles
Antral follicles were exposed in vitro to DMSO or DEHP (1–100μg/ml) for 96h and then collected and subjected to specific assays to measure the enzyme activities of SOD1, GPX and CAT. All values were normalized to protein level as a loading control and reported as relative fold change compared to DMSO controls. Graph represents means ± SEMs from at least three separate experiments. Asterisk (*) indicates a significant difference from DMSO controls via ANOVA followed by Tukey’s HSD post hoc test (n=24 follicles per treatment per experiment; p≤ 0.05).
Fig. 7
Fig. 7. Effect of DEHP exposure on SOD1 activity profile in antral follicles
Antral follicles were exposed in vitro to DMSO or DEHP (10 μg/ml) for 24, 48, 72 and 96h and subjected to SOD1 activity assays for analysis of Sod1 activity over time. All values were normalized to protein level as a loading control and shown as relative fold change compared to 24h DMSO controls. Graph represents means ± SEMs from at least 3 separate experiments. Asterisk (*) indicates a significant p value from the DMSO controls at same time point via ANOVA, post hoc Tukey’s HSD (n=16 follicles per treatment per experiment; p≤ 0.05).
Fig. 8
Fig. 8. Effect of DEHP and NAC co-treatment on SOD1 expression and activity in antral follicles
Antral follicles were cultured in the presence of DMSO or DEHP (10μg/ml) ± NAC (0.25–1mM) for 96h. After culture, the follicles were collected and subjected to real-time PCR analysis for mRNA expression of Sod1 (A) and activity assays for SOD1 activity (B). The expression of Sod1 was normalized to β-actin as a loading control and the activity of SOD1 was normalized to protein level as a loading control. All values were reported as relative fold change compared to DMSO controls. Graph represents means ± SEMs from at least three separate experiments. Asterisk (*) indicates a significant p value from the DMSO controls via ANOVA followed by Tukey’s HSD post hoc test (n=16–24 follicles per treatment per experiment; p≤ 0.05).

References

    1. Agarwal A, Gupta S, Sekhon L, Shah R. Redox considerations in female reproductive function and assisted reproduction: from molecular mechanisms to health implications. Antioxid Redox Signal. 2008;10:1375–1403. - PubMed
    1. Agarwal A, Gupta S, Sharma RK. Role of oxidative stress in female reproduction. Reprod Biol Endocrinol. 2005;3:28. - PMC - PubMed
    1. Al-Gubory KH, Fowler PA, Garrel C. The roles of cellular reactive oxygen species, oxidative stress and antioxidants in pregnancy outcomes. Int J Biochem Cell Biol. 2010;42:1634–1650. - PubMed
    1. Banning A, Deubel S, Kluth D, Zhou Z, Brigelius-Flohe R. The GI-GPx gene is a target for Nrf2. Mol Cell Biol. 2005;25:4914–4923. - PMC - PubMed
    1. Botelho GG, Bufalo AC, Boareto AC, Muller JC, Morais RN, Martino-Andrade AJ, Lemos KR, Dalsenter PR. Vitamin C and resveratrol supplementation to rat dams treated with di(2-ethylhexyl)phthalate: impact on reproductive and oxidative stress end points in male offspring. Arch Environ Contam Toxicol. 2009;57:785–793. - PubMed

Publication types

MeSH terms