Comparative Study
. 2012 Mar;60(1):279-89.
doi: 10.1016/j.neuroimage.2011.11.081. Epub 2011 Dec 6.

A general analysis of calibrated BOLD methodology for measuring CMRO2 responses: comparison of a new approach with existing methods

Affiliations
Comparative Study

A general analysis of calibrated BOLD methodology for measuring CMRO2 responses: comparison of a new approach with existing methods

Nicholas P Blockley et al. Neuroimage. 2012 Mar.

Abstract

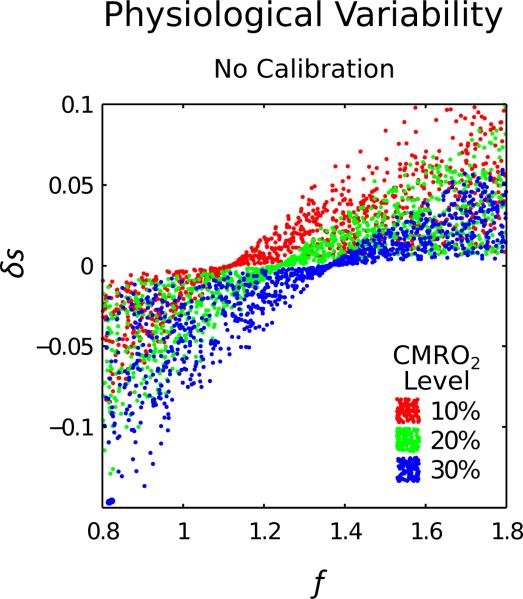
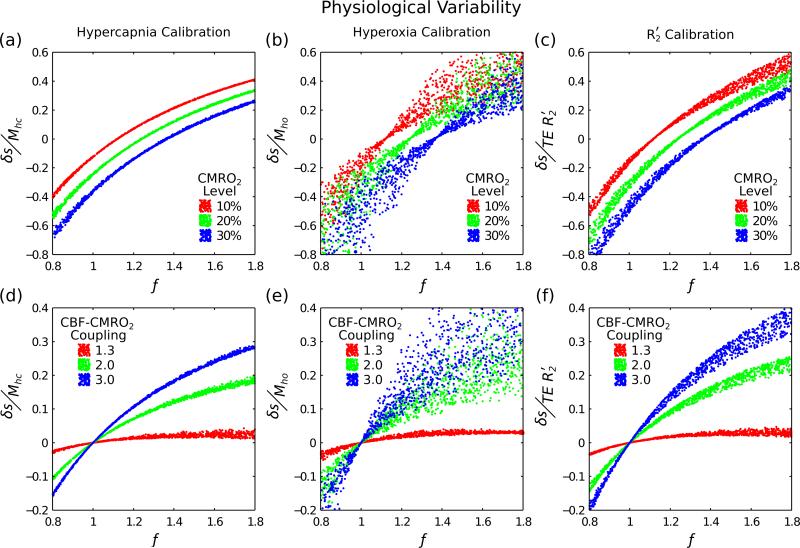
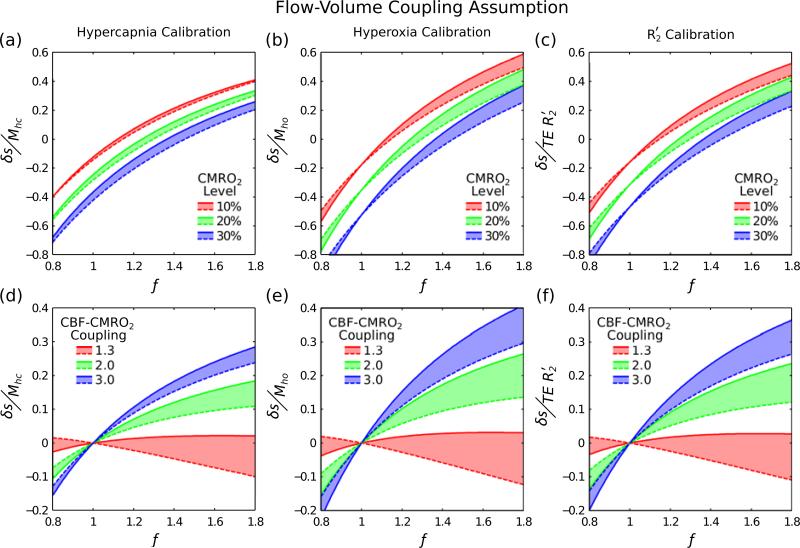
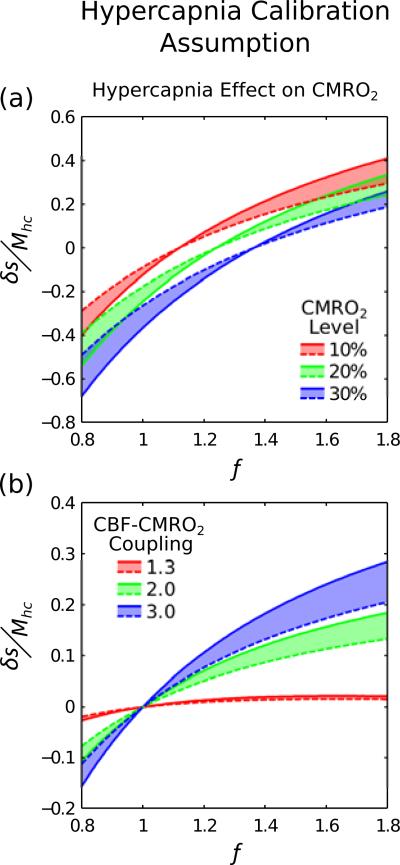
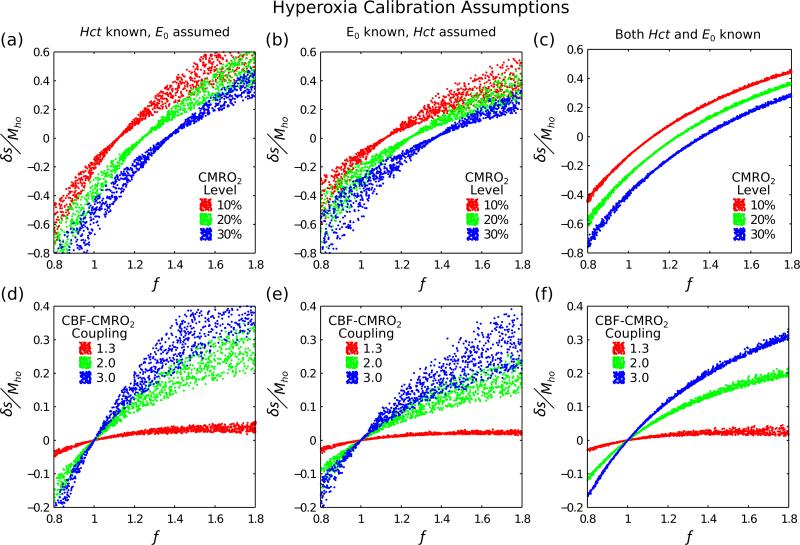
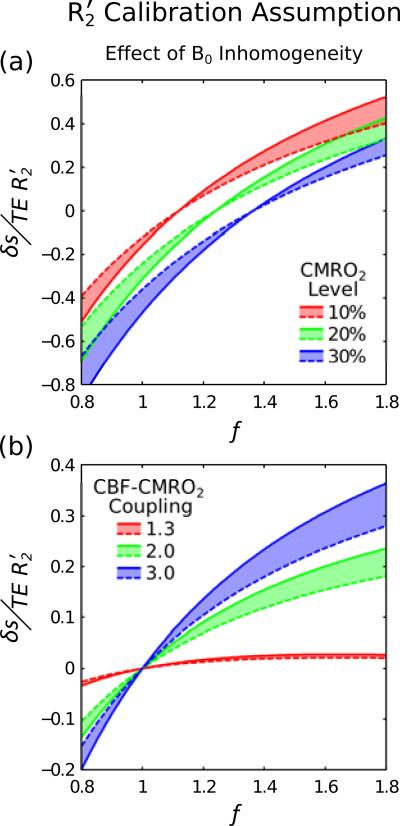
The amplitude of the BOLD response to a stimulus is not only determined by changes in cerebral blood flow (CBF) and oxygen metabolism (CMRO(2)), but also by baseline physiological parameters such as haematocrit, oxygen extraction fraction (OEF) and blood volume. The calibrated BOLD approach aims to account for this physiological variation by performing an additional calibration scan. This calibration typically consists of a hypercapnia or hyperoxia respiratory challenge, although we propose that a measurement of the reversible transverse relaxation rate, R(2)', might also be used. A detailed model of the BOLD effect was used to simulate each of the calibration experiments, as well as the activation experiment, whilst varying a number of physiological parameters associated with the baseline state and response to activation. The effectiveness of the different calibration methods was considered by testing whether the BOLD response to activation scaled by the calibration parameter combined with the measured CBF provides sufficient information to reliably distinguish different levels of CMRO(2) response despite underlying physiological variability. In addition the effect of inaccuracies in the underlying assumptions of each technique were tested, e.g. isometabolism during hypercapnia. The three primary findings of the study were: 1) The new calibration method based on R(2)' worked reasonably well, although not as well as the ideal hypercapnia method; 2) The hyperoxia calibration method was significantly worse because baseline haematocrit and OEF must be assumed, and these physiological parameters have a significant effect on the measurements; and 3) the venous blood volume change with activation is an important confounding variable for all of the methods, with the hypercapnia method being the most robust when this is uncertain.


Figures

Figure 1
Figure 1
The effect of physiological variability in haematocrit, baseline oxygen extraction fraction and baseline blood volume on the relationship between the BOLD response (δs) and CBF (f). These simulations show that the effect of physiological variability on δs does not allow 10% step changes in CMRO2 to clearly separated, confirming that this information is insufficient to accurately measure CMRO2.
Figure 2
Figure 2
Three different calibration techniques were investigated to account for physiological variability; hypercapnia, hyperoxia, and R2′ calibration (columns left-right). By simultaneously varying haematocrit (0.37-0.50), oxygen extraction fraction (0.30-0.55) and blood volume (0.01-0.10) we are able to assess how well each method copes with this physiological variability. Simulations were performed for both fixed increases in CMRO2 (top row) and for fixed coupling of CBF and CMRO2 (Eq. (10)) (bottom row). For a perfect calibration each of simulated points should fall on a single curve, which should be distinctly different for each CMRO2 level or CBF-CMRO2 coupling value.
Figure 3
Figure 3
An inaccurate assumption of the flow-volume coupling constant α would result in a systematic error. Here the effect of different underlying physiological values of this coupling were investigated where a solid line represents α=0.2 and the dashed line α=0.4. A minimal shift in the dashed line with respect to the solid line would reflect lower sensitivity to the assumed value of α. Physiological variability is not included in these simulations and haematocrit, oxygen extraction fraction and blood volume were assumed to be 0.45, 0.4, 0.05, respectively.
Figure 4
Figure 4
It has been observed that hypercapnia may cause a reduction in baseline CMRO2. Here we consider what effect this would have on hypercapnia calibration when CMRO2 is reduced by 15% (r=0.85 in Eq. (3)). Physiological variability was not included for clarity. Isometabolism (r=1) is plotted as a solid line whilst reduced CMRO2 is plotted as a dashed line. Shifting of the dashed line with respect to the solid line suggests that reduced baseline CMRO2 would have a marked effect on the accuracy of hypercapnia calibration.
Figure 5
Figure 5
Further investigation of hyperoxia calibration was undertaken to better understand the large observed variability. This was achieved by increasing the amount of information used to estimate the calibration scaling factor Mho; haematocrit known, oxygen extraction fraction known and both known (columns left-right). Physiological variability was included as it is the origin of the observed variability in Fig. 2b,e. More information about the baseline physiology reduces the variability in hyperoxia calibration.
Figure 6
Figure 6
It is well known that R2′ is sensitive to both mesoscopic and macroscopic sources of magnetic field inhomogeneity. The former represents the effect of blood vessels, which underlies the BOLD response, and the latter is caused by disturbance of the magnetic field by the head. Here we compare perfect field homogeneity (Δω=0), plotted as a solid line, with a through slice gradient Δω=20 Hz, plotted as a dashed line. Shifting of the dashed line with respect to the solid line emphasises that macroscopic field inhomogeneity effects must be minimised.

References

    1. An H, Lin W. Impact of intravascular signal on quantitative measures of cerebral oxygen extraction and blood volume under normo- and hypercapnic conditions using an asymmetric spin echo approach. Magn. Reson. Med. 2003;50:708–716. - PubMed
    1. Biswal BB, Kannurpatti SS, Rypma B. Hemodynamic scaling of fMRI-BOLD signal: validation of low-frequency spectral amplitude as a scalability factor. Magn Reson Imaging. 2007;25:1358–1369. - PMC - PubMed
    1. Boxerman JL, Hamberg LM, Rosen BR, Weisskoff RM. MR contrast due to intravascular magnetic susceptibility perturbations. Magn. Reson. Med. 1995;34:555–566. - PubMed
    1. Castellani RJ, Siedlak SL, Perry G, Smith MA. Sequestration of iron by Lewy bodies in Parkinson's disease. Acta Neuropathol. 2000;100:111–114. - PubMed
    1. Chen JJ, Pike GB. BOLD-specific cerebral blood volume and blood flow changes during neuronal activation in humans. NMR Biomed. 2009;22:1054–1062. - PubMed

Publication types