

Diagnosis of osteoarthritis: imaging
- PMID: 22155587
- PMCID: PMC3306456
- DOI: 10.1016/j.bone.2011.11.019
Diagnosis of osteoarthritis: imaging
Abstract
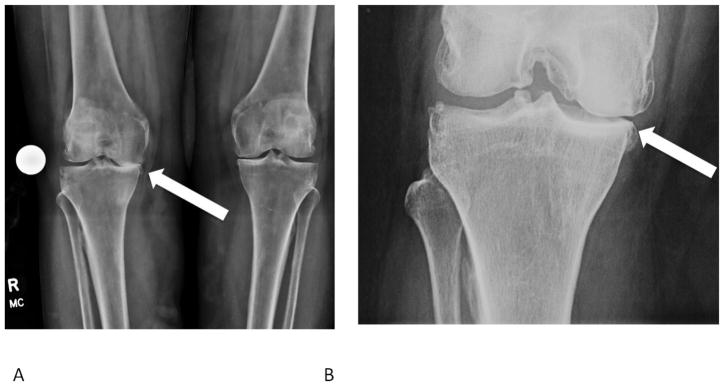
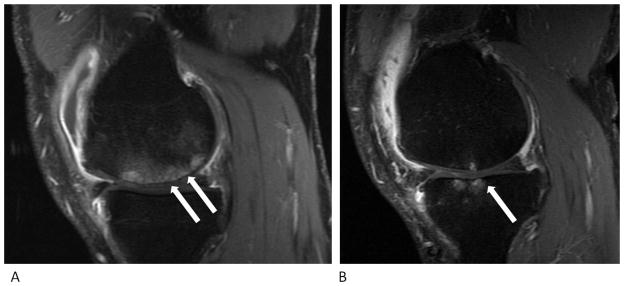
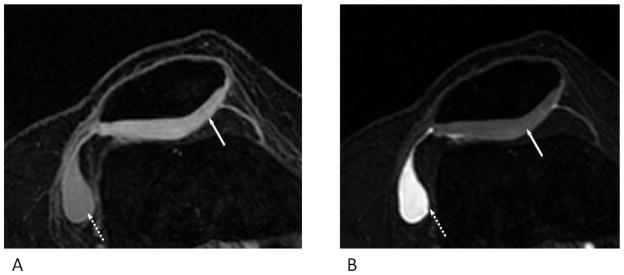
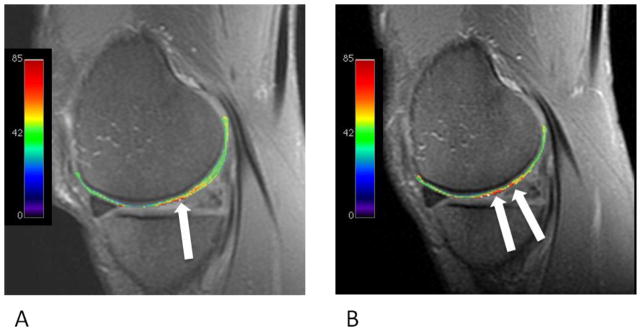
Osteoarthritis (OA) is a chronic, debilitating joint disease characterized by degenerative changes to the bones, cartilage, menisci, ligaments, and synovial tissue. Imaging modalities such as radiography, magnetic resonance imaging (MRI), optical coherence tomography (OCT), and ultrasound (US) permit visualization of these structures and can evaluate disease onset and progression. Radiography is primarily useful for the assessment of bony structures, while OCT is used for evaluation of articular cartilage and US for ligaments and the synovium. MRI permits visualization of all intraarticular structures and pathologies, though US or OCT may be preferential in some circumstances. As OA is a disease of the whole joint, a combination of imaging techniques may be necessary in order to gain the most comprehensive picture of the disease state. This article is part of a Special Issue entitled "Osteoarthritis".
Copyright © 2011 Elsevier Inc. All rights reserved.
Conflict of interest statement
Figures
Similar articles
-
Shoulder Arthrogram.2023 Apr 3. In: StatPearls [Internet]. Treasure Island (FL): StatPearls Publishing; 2025 Jan–. 2023 Apr 3. In: StatPearls [Internet]. Treasure Island (FL): StatPearls Publishing; 2025 Jan–. PMID: 35593869 Free Books & Documents.
-
Imaging modalities in hand osteoarthritis--and perspectives of conventional radiography, magnetic resonance imaging, and ultrasonography.Arthritis Res Ther. 2011;13(6):248. doi: 10.1186/ar3509. Epub 2011 Dec 13. Arthritis Res Ther. 2011. PMID: 22189142 Free PMC article. Review.
-
The role of imaging in osteoarthritis.Best Pract Res Clin Rheumatol. 2014 Feb;28(1):31-60. doi: 10.1016/j.berh.2014.02.002. Best Pract Res Clin Rheumatol. 2014. PMID: 24792944 Review.
-
Imaging of osteoarthritis: update from a radiological perspective.Curr Opin Rheumatol. 2011 Sep;23(5):484-91. doi: 10.1097/BOR.0b013e328349c2d2. Curr Opin Rheumatol. 2011. PMID: 21760511 Review.
-
Cartilage imaging in osteoarthritis.Semin Arthritis Rheum. 1996 Feb;25(4):273-81. doi: 10.1016/s0049-0172(96)80037-0. Semin Arthritis Rheum. 1996. PMID: 8834015 Review.
Cited by
-
Mesenchymal Stromal Cell-Based Therapy-An Alternative to Arthroplasty for the Treatment of Osteoarthritis? A State of the Art Review of Clinical Trials.J Clin Med. 2020 Jun 30;9(7):2062. doi: 10.3390/jcm9072062. J Clin Med. 2020. PMID: 32630066 Free PMC article. Review.
-
Reliability of a Proposed Ultrasonographic Grading Scale for Severity of Primary Knee Osteoarthritis.Clin Med Insights Arthritis Musculoskelet Disord. 2016 Jul 24;9:161-6. doi: 10.4137/CMAMD.S38141. eCollection 2016. Clin Med Insights Arthritis Musculoskelet Disord. 2016. PMID: 27478389 Free PMC article.
-
[Current MR imaging of cartilage in the context of knee osteoarthritis (part 1) : Principles and sequences].Radiologie (Heidelb). 2024 Apr;64(4):295-303. doi: 10.1007/s00117-023-01252-2. Epub 2023 Dec 29. Radiologie (Heidelb). 2024. PMID: 38158404 Review. German.
-
Relationship Between the Choice of Clinical Treatment, Gait Functionality and Kinetics in Patients With Comparable Knee Osteoarthritis.Front Bioeng Biotechnol. 2022 Mar 11;10:820186. doi: 10.3389/fbioe.2022.820186. eCollection 2022. Front Bioeng Biotechnol. 2022. PMID: 35360402 Free PMC article.
-
Osteoarthritis pathogenesis - a complex process that involves the entire joint.J Med Life. 2014 Mar 15;7(1):37-41. Epub 2014 Mar 25. J Med Life. 2014. PMID: 24653755 Free PMC article. Review.
References
-
- Altman RD, Gold GE. Atlas of individual radiographic features in osteoarthritis, revised. Osteoarthritis Cartilage. 2007;15 (Suppl A):A1–56. - PubMed
-
- Gold GE, Mosher TJ. Arthritis in Color: Advanced Imaging of Osteoarthritis. Philadelphia: Elsevier Saunders; 2009. pp. 153–192.
-
- Felson DT, Niu J, Guermazi A, Roemer F, Aliabadi P, Clancy M, Torner J, Lewis CE, Nevitt MC. Correlation of the development of knee pain with enlarging bone marrow lesions on magnetic resonance imaging. Arthritis Rheum. 2007;56:2986–92. - PubMed
-
- Hunter DJ, Lo GH, Gale D, Grainger AJ, Guermazi A, Conaghan PG. The reliability of a new scoring system for knee osteoarthritis MRI and the validity of bone marrow lesion assessment: BLOKS (Boston Leeds Osteoarthritis Knee Score) Ann Rheum Dis. 2008;67:206–11. - PubMed
Publication types
MeSH terms
Grants and funding
LinkOut - more resources
Full Text Sources
Other Literature Sources
Medical
Research Materials
