. 2012 Mar;63(5):1919-36.
doi: 10.1093/jxb/err375. Epub 2011 Dec 9.

The plastid outer envelope protein OEP16 affects metabolic fluxes during ABA-controlled seed development and germination

Affiliations

The plastid outer envelope protein OEP16 affects metabolic fluxes during ABA-controlled seed development and germination

Birgit Pudelski et al. J Exp Bot. 2012 Mar.

Abstract

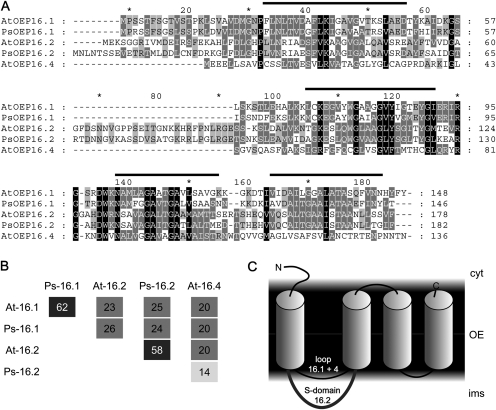
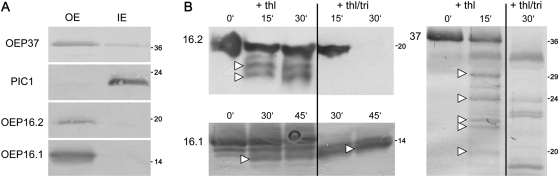
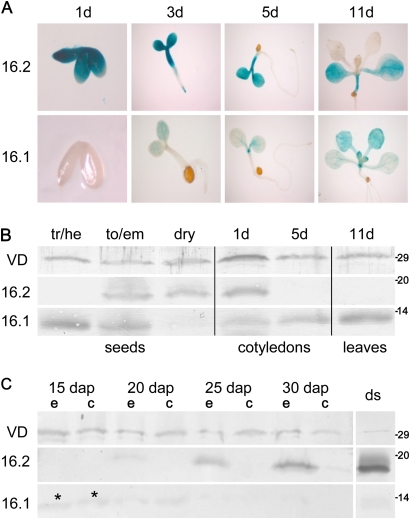
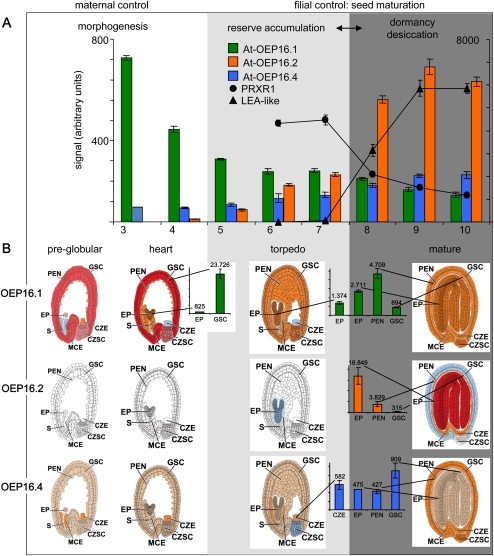
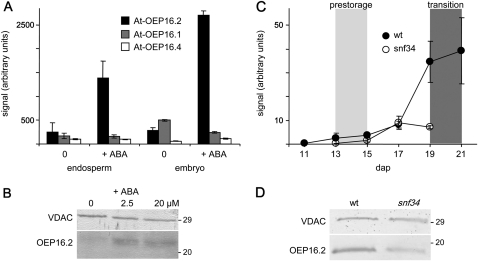
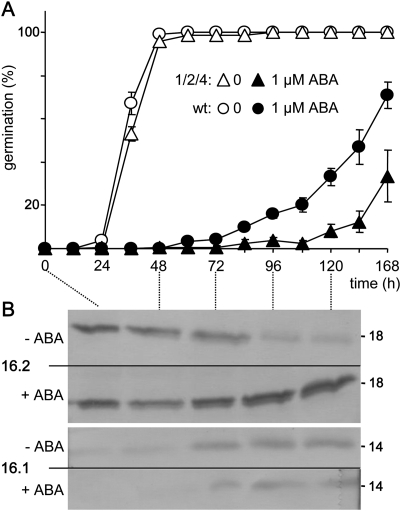
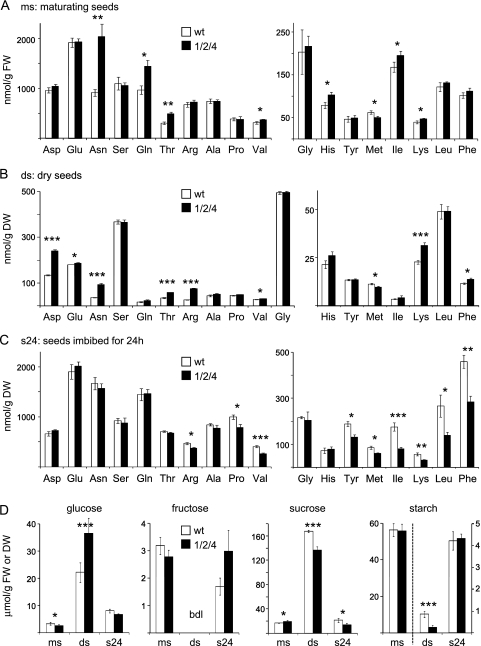
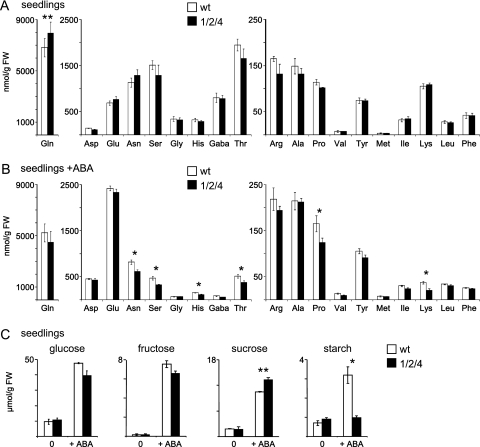
Previously, the OEP16.1 channel pore in the outer envelope membrane of mature pea (Pisum sativum) chloroplasts in vitro has been characterized to be selective for amino acids. Isolation of OEP16.2, a second OEP16 isoform from pea, in the current study allowed membrane localization and gene expression of OEP16 to be followed throughout seed development and germination of Arabidopsis thaliana and P. sativum. Thereby it can be shown on the transcript and protein level that the isoforms OEP16.1 and OEP16.2 in both plant species are alternating: whereas OEP16.1 is prominent in early embryo development and first leaves of the growing plantlet, OEP16.2 dominates in late seed development stages, which are associated with dormancy and desiccation, as well as early germination events. Further, OEP16.2 expression in seeds is under control of the phytohormone abscisic acid (ABA), leading to an ABA-hypersensitive phenotype of germinating oep16 knockout mutants. In consequence, the loss of OEP16 causes metabolic imbalance, in particular that of amino acids during seed development and early germination. It is thus concluded that in vivo OEP16 most probably functions in shuttling amino acids across the outer envelope of seed plastids.


Figures

Fig. 1.
Fig. 1.
Structure and membrane topology of OEP16 proteins. (A) Amino acid sequence alignment of OEP16 isoforms from Arabidopsis and pea. Bars indicate the positions of the four membrane-spanning α-helices as defined for Ps-OEP16.1 (Linke et al., 2004). Identical and similar amino acids shared by all (100%), three or more (≥60%), and two (≥40%) of the sequences are shaded in black, dark grey, and light grey, respectively. (B) Percentage of identical amino acids between the proteins aligned in A. Identities among distinct OEP16.1 and OEP16.2 isoforms of different species are >58% (dark grey squares). (C) Topology model of OEP16 proteins in the outer envelope membrane (OE) of plastids. α-Helical membrane domains (cylinders) are depicted as defined for Ps-OEP16.1 (Linke et al., 2004). Please note that only the N-terminus and the extended interhelical loop region between the first and second helix (compare with alignment in A), which defines the S-domain of OEP16.2 (Drea et al., 2006), most probably are not embedded in the lipid bilayer environment. Cyt, cytosol; ims, intermembrane space.
Fig. 2.
Fig. 2.
Localization of OEP16.1 and OEP16.2 in the plastid outer envelope membrane. For immunodetection of OEP16.2, envelope membranes were prepared from isolated chloroplasts of 7-day-old pea seedlings (all others: 10-day-old plants). Numbers indicate the molecular mass of proteins in kDa. (A) Immunoblot analysis of Ps-OEP16.1 and Ps-OEP16.2 in purified outer (OE) and inner (IE) envelope membranes from pea chloroplasts. Antisera against the proteins Ps-OEP37 (OE) and PIC1 (IE) were used as controls. Equal amounts of proteins were loaded per lane: for detection of OEP37, 5 μg; for PIC1, 20 μg; for OEP16.2, 30 μg; and for OEP16.1, 1 μg. (B) Outer envelope membrane vesicles from pea chloroplasts were protease digested with thermolysin (thl) and subsequently subjected to immunblot analysis for Ps-OEP16.2, Ps-OEP16.1, and Ps-OEP37. Thermolysin was incubated for 0–45 min in a 2:1 ratio (w/w) per μg of envelope proteins. To solubilize membranes, 1% Triton (+thl/tri) was added in control assays. For detection of OEP16.2 (upper panel) 90 μg, and for OEP16.1 (lower panel) and OEP37 (right panel) 2.5 μg of protein were loaded equally in each lane. Arrowheads indicate major digestion fragments. For the control OEP37, fragment sizes correspond to those detected by Schleiff et al. (2003).
Fig. 3.
Fig. 3.
OEP16.1 and OEP16.2 expression during seed development and germination. (A) Histochemical detection of GUS activity directed by the At-OEP16.1 and At-OEP16.2 promoter in transgenic Arabidopsis plants. GUS expression was monitored after germination for 1, 3, 5, and 11 d. For the 1-day-old tissue (1d) the seed coat was removed manually. Pictures show representative results for at least three different transgenic lines. (B) Immunoblot analysis of At-OEP16.1 and At-OEP16.2 in protein extracts from developing seeds (tr/he, transition/heart stage; to/em, torpedo/embryo stage), dry seeds, cotyledons (1–5 d old), and leaves (11 d old) of seedlings. For seeds 10 μg, and for seedlings 20 μg of protein were loaded in each lane. (C) Immunoblot of Ps-OEP16.2 and Ps-OEP16.1 in protein extracts (4 μg each) from developing and dry (ds) pea seeds. Seed stages are given in days after pollination (dap). During development seeds were separated into embryo (e) and seed coat (c) tissue, the latter containing endosperm layers. Asterisks indicate weak OEP16.1 signals in early embryo and seed coat (15 dap). (B and C) Antiserum against the marker protein VDAC (outer membrane of mitochondria) was used as loading control. Numbers indicate the molecular mass of proteins in kDa.
Fig. 4.
Fig. 4.
OEP16 expression profiles during Arabidopsis seed development. Data used to create the digital northern blots were obtained from the respective experiments deposited at the NASCArrays website (http://affy.arabidopsis.info/narrays/experimentbrowse.pl) and from the Harada-Goldberg Arabidopsis miccoarray data set of laser capture microdissected seeds (‘Gene Networks in Seed Development’ at http://estdb.biology.ucla.edu/seed/). Mean signal intensities (arbitrary units ±SD) were averaged from 2–3 replicates. Morphogenesis, reserve accumulation, and desiccation/dormancy phases are indicated by white, light grey, and dark grey background, respectively. (A) Embryo and seed development (AtGenExpress siliques and seeds, NASCARRAYS-154). The seed stages 3–10 are defined according to embryo development as follows: 3, mid-globular to early heart; 4, early heart to late heart; 5, late heart to mid-torpedo; 6, mid-torpedo to late torpedo; 7, late torpedo to early walking stick; 8, walking stick to early curled cotyledons; 9, curled cotyledons to early green cotyledons; 10, green cotyledons. Note that the seed stages 3–5 include silique tissue. Signals for At-OEP16.1 (green) and for At-OEP16.4 (blue) correspond to the right y-axis, while the left y-axis was scaled for At-OEP16.2 (orange) and the controls PRXR1 (dots) and LEA-like (triangles). Differential expression of the latter two genes defines the transcriptional switch from reserve accumulation to the acquirement of desiccation tolerance and dormancy. (B) Tissue-specific expression pattern of OEP16 isoforms in pre-globular, heart, torpedo, and mature seed stages (Harada-Goldberg Arabidopsis LCM Gene-Chip Data Set). Different tissues are defined as follows: CZE, chalazal endosperm; CZSC, chalazal seed coat; EP, embryo proper; GSC, general seed coat; MCE, micropylar endosperm; PEN, peripheral endosperm; S, suspensor. Signal values (arbitrary units) for At-OEP16.1 (green), At-OEP16.2 (orange), and At-OEP16.4 (blue) are presented in tissues with the highest expression (for complete data sets see Supplementary Fig. S3 and Supplementary Table S2 at JXB online). Seed tissues are coloured according to transcript density for signals that are absent (white), insufficient (blue), <500 (beige), 500–5000 (orange), 5000–10 000 (purple), and >10 000 (dark red).
Fig. 5.
Fig. 5.
Specific ABA induction of OEP16.2 expression in seeds. (A) Digital northern blot of At-OEP16.2 (black), At-OEP16.1 (grey), and At-OEP16.4 (white) expression (arbitrary units) in Arabidopsis endosperm and embryo tissue. Prior to dissection, seeds were germinated for 24 h without (0) and with 20 μM ABA (described in Penfield et al., 2004). Data used to create the expression profile were obtained from the analysis by Penfield et al. (2004) using NASCArrays database (http://affy.arabidopsis.info/narrays/experimentbrowse.pl), experiment NASCARRAYS 386. Signal intensities were averaged from three biological replicates (n=3, ±SD). (B) Western blot analysis of At-OEP16.2 in protein extracts (7.5 μg each) from Arabidopsis seeds, germinated for 48 h on medium containing 0, 2.5, and 20 μM ABA. (C) Transcript content of Ps-OEP16.2 (n=2, ±SD, arbitrary units) in developing pea seeds of the wild type (black) and the Vf-SnRK1-antisense line snf34 (white). The age of seeds is given in days after pollination (dap). According to the definition by Radchuk et al. (2006), delayed down-regulated genes are highly expressed in the pre-storage phase 13–15 dap (light grey area), and delayed up-regulated genes are continuously increased during seed maturation, starting in the transition phase at 19–22 dap (dark grey area). (D) Immunoblot analysis of Ps-OEP16.2 in protein extracts (4 μg each) from wild-type and VfSnRK1-antisense (snf34) pea seeds, isolated 20 dap. (B and D) Antiserum against the marker protein VDAC (outer membrane of mitochondria) was used as a loading control. Numbers indicate the molecular mass of proteins in kDa.
Fig. 6.
Fig. 6.
ABA hypersensitivity during germination of OEP16 triple mutants. (A) Germination rates of oep16 triple mutant (1/2/4, triangles) and corresponding wild-type seeds (circles). Seed germination on nylon filters was followed for 168 h in the absence and presence of 1 μM ABA (open and filled symbols, respectively). Data represent mean values ±SE of n=4 independent experiments. (B) Immunoblot analysis of At-OEP16.2 (upper panel) and At-OEP16.1 (lower panel) in protein extracts (25 μg each) from wild-type Arabidopsis seeds, germinated as described in A. Numbers indicate the molecular mass of proteins in kDa. (–), no ABA; (+), addition of 1 μM ABA.
Fig. 7.
Fig. 7.
Amino acid and sugar content during seed maturation of the oep16 triple mutant and wild type. Metabolites were determined in maturing seeds (ms), dry seeds (ds), and seeds imbibed for 24 h (s24) of the oep16.1/2/4 triple mutant and corresponding wild type (black and white bars, respectively). Maturing seeds correspond to stages 7–10 as depicted in Fig. 4A. Data represent mean values of independent biological replicates (n=3–4, ±SD). Please note that while concentrations for maturing seeds are given per gram of tissue fresh weight (FW), they are related to dry weight (DW) for dry and imbibed seeds. Significance analysis was performed by a Student’s t-test with P-values <0.05 (*); <0.01 (**); and <0.005 (***), respectively. For complete data sets see Supplementary Table S3 at JXB online. (A–C) Amino acid concentration (nmol/g FW or DW). Tryptophan and cysteine were not determined. (D) Glucose, fructose, sucrose, and starch (μmol/g FW or DW). Fructose values in dry seeds were below the detection limit (bdl) of the analysis. For starch, the right y-axis is scaled for concentrations in dry and imbibed seeds.
Fig. 8.
Fig. 8.
Amino acid and sugar content of oep16 triple mutant and wild-type seedlings. (A and B) Amino acid concentrations (nmolg FW, n=3–4 ±SD) in 6-day-old seedlings of the oep16 triple mutant (1/2/4, black bars) and wild type (white bars). Seedlings were grown on nylon filters in the absence (A) and presence of 1 μM ABA (B). Tryptophan and cysteine were not determined. (C) Glucose, fructose, sucrose, and starch concentrations (μmol/g FW, n=3–4, ±SD) in seedling tissue described in A and B. Significance analysis was performed by a Student’s t-test with P-values <0.05 (*); <0.01 (**); and <0.005 (***), respectively. For complete data sets see Supplementary Table S3 at JXB online.

Similar articles

Cited by

References

    1. Angelovici R, Fait A, Fernie AR, Galili G. A seed high-lysine trait is negatively associated with the TCA cycle and slows down Arabidopsis seed germination. New Phytologist. 2011;189:148–159. - PubMed
    1. Angelovici R, Fait A, Zhu X, Szymanski J, Feldmesser E, Fernie AR, Galili G. Deciphering transcriptional and metabolic networks associated with lysine metabolism during Arabidopsis seed development. Plant Physiology. 2009;151:2058–2072. - PMC - PubMed
    1. Angelovici R, Galili G, Fernie AR, Fait A. Seed desiccation: a bridge between maturation and germination. Trends in Plant Science. 2010;15:211–218. - PubMed
    1. Bassel GW, Lan H, Glaab E, Gibbs DJ, Gerjets T, Krasnogor N, Bonner AJ, Holdsworth MJ, Provart NJ. Genome-wide network model capturing seed germination reveals coordinated regulation of plant cellular phase transitions. Proceedings of the National Academy of Sciences, USA. 2011;108:9709–9714. - PMC - PubMed
    1. Bonneville JM, Tichtinsky G. Correction for ‘A plant porphyria related to defects in plastid import of protochlorophyllide oxidoreductase’. Proceedings of the National Academy of Sciences, USA. 2010;107:5693. - PMC - PubMed

Publication types

MeSH terms