. 2012 Mar;81(3):411-9.
doi: 10.1124/mol.111.076067. Epub 2011 Dec 9.

Transient receptor potential vanilloid-1 (TRPV1) is a mediator of lung toxicity for coal fly ash particulate material

Affiliations

Transient receptor potential vanilloid-1 (TRPV1) is a mediator of lung toxicity for coal fly ash particulate material

Cassandra E Deering-Rice et al. Mol Pharmacol. 2012 Mar.

Abstract

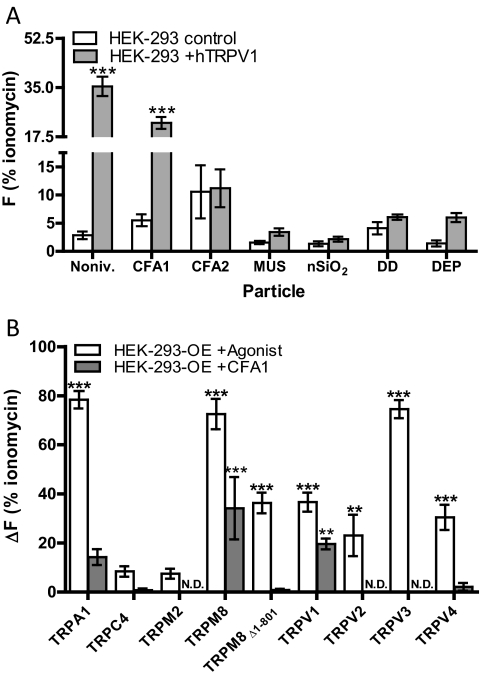
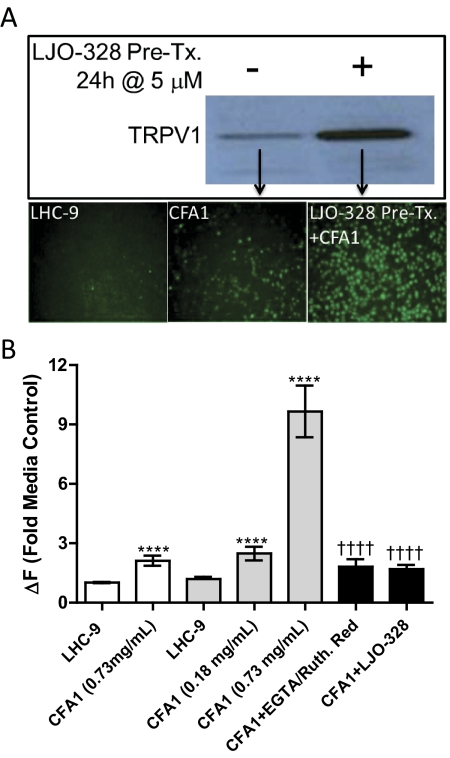
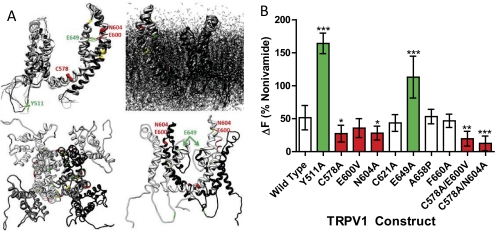
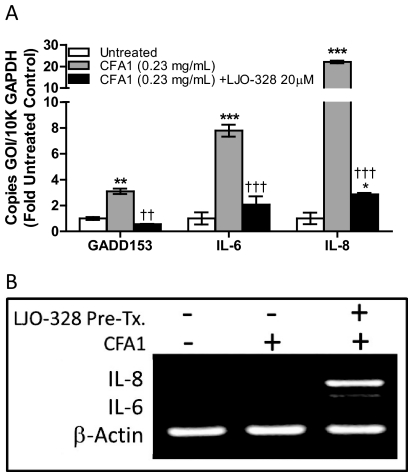
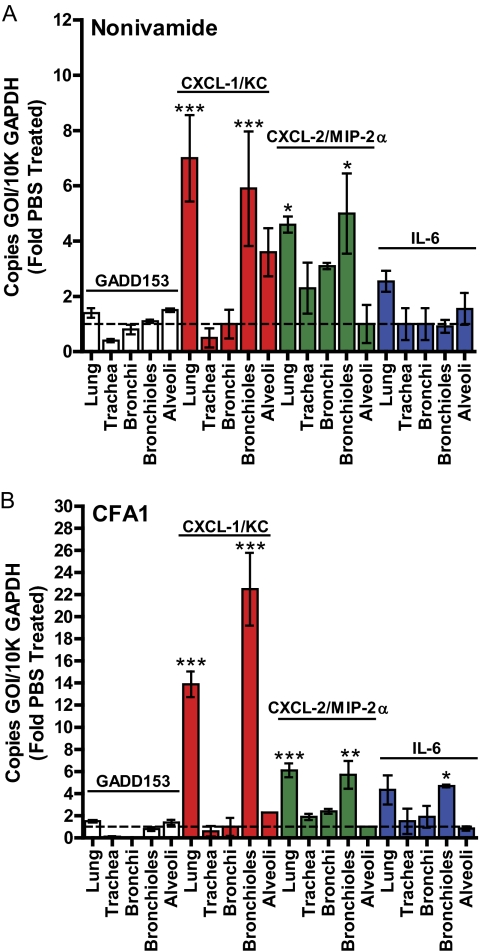
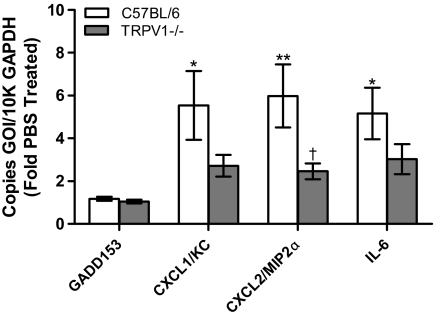
Environmental particulate matter (PM) pollutants adversely affect human health, but the molecular basis is poorly understood. The ion channel transient receptor potential vanilloid-1 (TRPV1) has been implicated as a sensor for environmental PM and a mediator of adverse events in the respiratory tract. The objectives of this study were to determine whether TRPV1 can distinguish chemically and physically unique PM that represents important sources of air pollution; to elucidate the molecular basis of TRPV1 activation by PM; and to ascertain the contributions of TRPV1 to human lung cell and mouse lung tissue responses exposed to an insoluble PM agonist, coal fly ash (CFA1). The major findings of this study are that TRPV1 is activated by some, but not all of the prototype PM materials evaluated, with rank-ordered responses of CFA1 > diesel exhaust PM > crystalline silica; TRP melastatin-8 is also robustly activated by CFA1, whereas other TRP channels expressed by airway sensory neurons and lung epithelial cells that may also be activated by CFA1, including TRPs ankyrin 1 (A1), canonical 4α (C4α), M2, V2, V3, and V4, were either slightly (TRPA1) or not activated by CFA1; activation of TRPV1 by CFA1 occurs via cell surface interactions between the solid components of CFA1 and specific amino acid residues of TRPV1 that are localized in the putative pore-loop region; and activation of TRPV1 by CFA1 is not exclusive in mouse lungs but represents a pathway by which CFA1 affects the expression of selected genes in lung epithelial cells and airway tissue.


Figures

Fig. 1.
Fig. 1.
A, nonivamide, CFA1, MUS, and DEP activate TRPV1 and cause calcium influx (ΔF) into TRPV1-expressing HEK-293 cells (gray bars) versus control HEK-293 cells (white bars). Nonivamide (Noniv.; positive control for TRPV1) was applied at 25 μM for 1 min, and PM was applied at 0.73 mg/ml for 3 min. Data are the mean and SEM (n ≥ 3) for ΔF relative to ionomycin (10 μM) and asterisks indicate a statistical difference between control HEK-293 cells and TRPV1-overexpressing HEK-293 cells when treated with PM using two-way ANOVA and post-testing using the Bonferroni multiple comparisons test. B, CFA1 activates TRPV1, TRPM8, and TRPA1. HEK-293 cells transiently (TRPV1 and TRPM8Δ1–801) or stably (all others) overexpressing human TRP channels were treated with a prototype agonist for the specific receptor (white bars) or CFA1 at 0.73 mg/ml for 3 min (gray bars). The prototype agonists were used at a concentration determined to yield a maximum receptor-specific response: TRPA1 (AITC, 150 μM); TRPC4α (carbachol, 0.75 μM); TRPM2 (H2O2, 1 mM); TRPM8 (icilin, 50 μM); TRPM8Δ1–801 [(−)-menthol, 2500 μM]; TRPV1 (nonivamide, 25 μM); TRPV2 (THC, 100 μM); TRPV3 (carvacrol, 250 μM); and TRPV4 (GSK1016790A, 0.0125 μM). Data are the mean and S.E.M. (n ≥ 3) for ΔF relative to ionomycin (10 μM), and asterisks indicate a statistically significant response in overexpressing cells versus HEK-293 cells treated with either a prototypical receptor agonist or CFA1 using 2-way ANOVA and post-testing using the Bonferroni multiple comparisons test. **, p < 0.01; ***, p < 0.001; N.D. = no response detected.
Fig. 2.
Fig. 2.
A, pretreatment of TRPV1-OE BEAS-2B cells with LJO-328 (5 μM; 24 h) stimulates cell surface expression of TRPV1 and CFA1-induced calcium flux. Top, increased recovery and detection of TRPV1 in cell surface protein isolates of LJO-328 pretreated TRPV1-OE (right lane) versus nonpretreated TRPV1-OE cells (left lane) by western blot. Bottom, images showing calcium flux in TRPV1-OE cells treated with LHC-9 media (negative control; left), 0.73 mg/ml CFA1 for 3 min (center), or LJO-pretreated cells (right) treated with 0.73 mg/ml CFA1 for 3 min. Bright green spots represent fluorescent cells where TRPV1-mediated calcium flux was observed. B, quantitation of calcium flux in TRPV1-OE cells treated with CFA1, with or without LJO-328 pretreatment and inhibition of calcium flux by total (LJO-328) or cell-impermeable and nonselective (EGTA and Ruthenium red) TRPV1 inhibitors. The white bars represent calcium flux in normal TRPV1-OE cells treated with LHC-9 (negative control) or CFA1 at 0.73 mg/ml for 3 min, the light gray bars represent LJO-328 pretreated TRPV1-OE cells treated with either LHC-9 or CFA1 at 0.18 or 0.73 mg/ml for 3 min, and the black bars represent LJO-328 pretreated TRPV1-OE cells cotreated with CFA1 at 0.73 mg/ml for 3 min and either EGTA + Ruthenium red (50 + 250 μM) or LJO-328 (20 μM). Data are the mean and SEM (n = 5) and asterisks indicate a statistical difference relative to the media control, or response to CFA1 between nonpretreated and LJO-328 pretreated cells. Daggers indicate a significant reduction in response between LJO-328 pretreated cells treated with CFA1, with and without inhibitor cotreatment using one-way ANOVA with post-testing using the Bonferroni multiple comparisons test. ****, p < 0.0001; ††††, p < 0.0001.
Fig. 3.
Fig. 3.
A, annotated homology model (Fernández-Ballester and Ferrer-Montiel, 2008) of a TRPV1 subunit outside and inside the cell membrane (top images), the TRPV1 tetramer viewed from the outside in (bottom left image), and two TRPV1 subunits (lower right image), highlighting residues effecting TRPV1 activation by CFA1. B, quantitative calcium flux results showing that pore-loop residues of TRPV1 regulate responses to CFA1. The images in Fig. 3, A and B, are color-coded where green represents stimulatory point mutations and red for inhibitory point or double mutants. Data are the mean and S.E.M. (n ≥ 5) and asterisks indicate a statistical difference relative to wild-type TRPV1 using ANOVA with Dunnett's multiple comparison post test. *, p<0.05; **, p < 0.01; ***, p < 0.001.
Fig. 4.
Fig. 4.
A, CFA1-induced changes in GADD153, IL-6, and IL-8 mRNA in NHBE cells after 24-h treatment at 37°C with 0.23 mg/ml CFA1. Control (white bars), CFA1 (gray bars), and CFA1 plus LJO-328 (20 μM) cotreatment (black bars). Data are the mean and S.E.M. (n = 3), and asterisks indicate a statistical increase in mRNA abundance relative to untreated control cells, whereas daggers indicate a decrease in mRNA induction with LJO-328 cotreatment using two-way ANOVA with a Bonferroni multiple comparisons post test. B, image of PCR-amplified DNA for IL-6, IL-8, and β-actin DNA in an ethidium bromide-stained 2% agarose gel. cDNA was prepared from TRPV1-OE cells treated with LHC-9 (negative control; left lane), 0.43 mg/ml CFA1 (center lane), and LJO-328 pretreated TRPV1-OE cells treated with CFA1 (0.43 mg/ml) for 4h at 37°C. **, p < 0.01; ***, p < 0.001; ††, p < 0.01; †††, p < 0.001.
Fig. 5.
Fig. 5.
Quantification of GADD153, CXCL-1/KC, CXCL-2/MIP-2α, and IL-6 mRNA, relative to GAPDH mRNA, in CF-1 mouse respiratory tissues by quantitative real-time PCR, 4 h after intratracheal administration of nonivamide (0.5 mg/kg) (A) or CFA1 (250 μg) (B). Data are the mean and S.E.M. (n ≥ 3), and asterisks indicate statistical significance relative to PBS-treated mice using two-way ANOVA with a Bonferroni multiple comparisons post test. *, p < 0.05; **, p < 0.01; ***, p < 0.001.
Fig. 6.
Fig. 6.
Mouse lung histology. Sections of mouse lung were assessed at 160× magnification to localize CFA1 (brown/black materials) retained in the lung 4 h post intrethecal treatment with PM (250 μg). Images are characteristic of results from the analysis of CFA1-treated mouse lungs, and there was no evidence of such materials in lungs of PBS- or nonivamide-treated mice (images not shown).
Fig. 7.
Fig. 7.
Quantification of GADD153, CXCL-1/KC, CXCL-2/MIP-2α, and IL-6 mRNA, relative to GAPDH mRNA, in wild-type C57BL/6 (white bars) and TRPV1(−/−) C57BL/6 (gray bars) mouse lung tissue assayed by quantitative real-time PCR, 4 h after intratracheal administration of CFA1 (250 μg). Data are the mean and S.E.M. (n ≥ 6). Asterisks indicate statistical significance relative to PBS-treated controls and daggers indicate a statistical decrease in expression in TRPV1(−/−) mice relative to wild-type mice using two-way ANOVA with the Bonferroni multiple comparisons post-test. *, p < 0.05; **, p < 0.01; ††, p < 0.01; †, p < 0.05.

References

    1. Agopyan N, Bhatti T, Yu S, Simon SA. (2003a) Vanilloid receptor activation by 2- and 10-micron particles induces responses leading to apoptosis in human airway epithelial cells. Toxicol Appl Pharmacol 192:21–35 - PubMed
    1. Agopyan N, Head J, Yu S, Simon SA. (2004) TRPV1 receptors mediate particulate matter-induced apoptosis. Am J Physiol Lung Cell Mol Physiol 286:L563–L572 - PubMed
    1. Agopyan N, Li L, Yu S, Simon SA. (2003b) Negatively charged 2- and 10-microm particles activate vanilloid receptors, increase cAMP, and induce cytokine release. Toxicol Appl Pharmacol 186:63–76 - PubMed
    1. Ahern GP, Brooks IM, Miyares RL, Wang XB. (2005) Extracellular cations sensitize and gate capsaicin receptor TRPV1 modulating pain signaling. J Neurosci 25:5109–5116 - PMC - PubMed
    1. Bernstein JA, Alexis N, Barnes C, Bernstein IL, Bernstein JA, Nel A, Peden D, Diaz-Sanchez D, Tarlo SM, Williams PB. (2004) Health effects of air pollution. J Allergy Clin Immunol 114:1116–1123 - PubMed

Publication types