. 2012 Jan 7;57(1):225-40.
doi: 10.1088/0031-9155/57/1/225.

Incorporation of diffusion-weighted magnetic resonance imaging data into a simple mathematical model of tumor growth

Affiliations

Incorporation of diffusion-weighted magnetic resonance imaging data into a simple mathematical model of tumor growth

N C Atuegwu et al. Phys Med Biol. .

Abstract

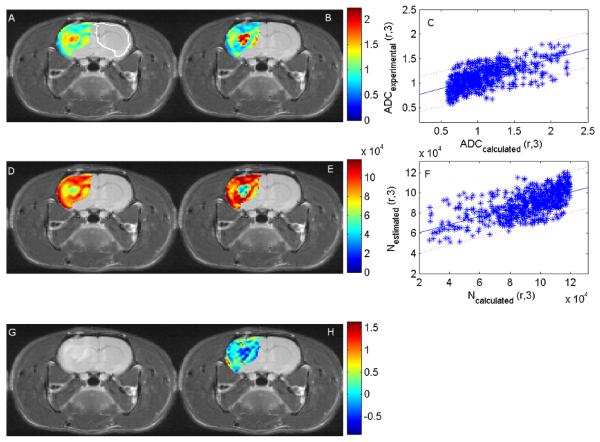
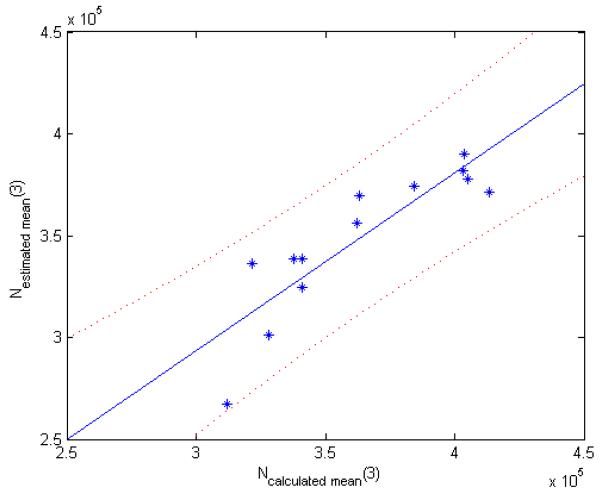
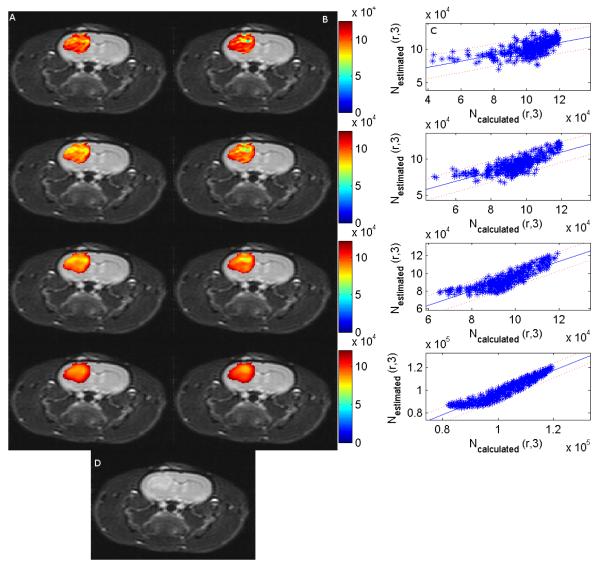
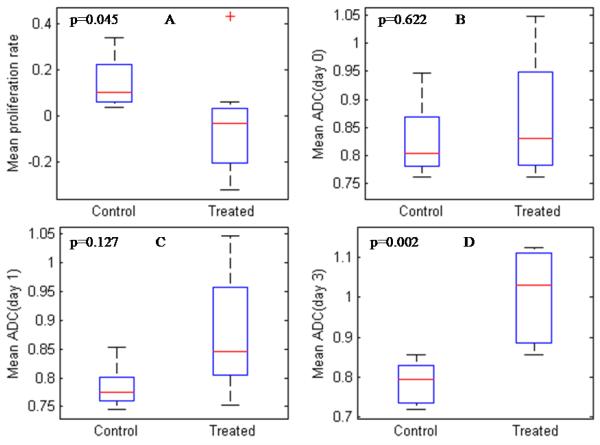
We build on previous work to show how serial diffusion-weighted MRI (DW-MRI) data can be used to estimate proliferation rates in a rat model of brain cancer. Thirteen rats were inoculated intracranially with 9L tumor cells; eight rats were treated with the chemotherapeutic drug 1,3-bis(2-chloroethyl)-1-nitrosourea and five rats were untreated controls. All animals underwent DW-MRI immediately before, one day and three days after treatment. Values of the apparent diffusion coefficient (ADC) were calculated from the DW-MRI data and then used to estimate the number of cells in each voxel and also for whole tumor regions of interest. The data from the first two imaging time points were then used to estimate the proliferation rate of each tumor. The proliferation rates were used to predict the number of tumor cells at day three, and this was correlated with the corresponding experimental data. The voxel-by-voxel analysis yielded Pearson’s correlation coefficients ranging from −0.06 to 0.65, whereas the region of interest analysis provided Pearson’s and concordance correlation coefficients of 0.88 and 0.80, respectively. Additionally, the ratio of positive to negative proliferation values was used to separate the treated and control animals (p <0.05) at an earlier point than the mean ADC values. These results further illustrate how quantitative measurements of tumor state obtained non-invasively by imaging can be incorporated into mathematical models that predict tumor growth.


Figures

Figure 1
Figure 1
The panels display an axial cross section through a rat brain with a tumor in the left hemisphere. Panels A and B are the experimental and the calculated ADC values (×10−3 mm2/s), respectively. The white outline in panel A was used to calculate the parameters for the contralateral tissue for comparison to the tumor values. Panel C compares these values with the 95% confidence interval indicated by the dotted lines. Similarly, panels D and E present the estimated and calculated number of cells at day 3, respectively, and Panel F compares these values with the 95% confidence interval indicated by the dotted lines. As in the case of the ADC values the Pearson’s correlation coefficient between the calculated and the estimated number of tumor cells is 0.65. Finally, panels G and H depict an anatomical T2 weighted image and the proliferation map calculated from ADC values on days 0 and 1. While the absolute values of the two methods do not quite match, there is general agreement in distribution between the estimated and calculated number of cells at day 3 and between the experimental and the calculated ADC values at day 3.
Figure 2
Figure 2
The figure displays a graph of the ROI average NCakuiated_mean(3) versus Nestimated_mean(3) for each rat with the 95% confidence interval displayed as dotted curves. Each point in the image represents one animal. There is a strong correlation between the mean estimated and the mean calculated number of cells in day 3 with a Pearson’s correlation coefficient of 0.88 (p = 0.0001) with a 95% confidence interval of (0.63, 0.96) for all the rats. The concordance correlation coefficient between Ncalculated_mean(3) and Nexperimental_mean(3) for all rats is 0.80 with a 95% confidence interval of (0.49, 0.93).
Figure 3
Figure 3
Columns A and B display an axial cross section through a rat brain with the experimentally determined number of cells at day 3 and the calculated number of cells at day 3, respectively. Column C is the corresponding plot of the calculated and the experimental number of cells at day 3 with the 95% confidence interval displayed. Panel D is the T2 weighted image at time 3.The different rows correspond to different degrees of smoothing with row 1 corresponding to the original image with no smoothing with a Pearson’s correlation of 0.61 between the experimental and the calculated number of cell at day 3; row 2 correspond to a convolution with a 2×2 averaging filter (r = 0.76); row 3 corresponds to a convolution with an 4×4 averaging filter (r = 0.86); and the last row corresponds to a convolution with an 8×8 averaging filter (r = 0.95). As the filter width increases, the correlation between the experimental and the calculated number of cells at day 3 increases which indicates that the weak correlation between the experimental and the calculated number of cells without filtering may be due to the relatively low SNR at which the images were acquired. However, as the smoothing increases, the fine details of the tumor are lost.
Figure 4
Figure 4
Panel A is a box plot of the mean proliferation rate estimated from days 0 and 1, while panels B, C and D are box plots of the mean ADC from days 0, 1 and 3, respectively. The mean proliferation rate can be used to separate the treated and the control animals (obtained from days 0 and 1; panel A) while the mean ADC cannot separate the treated and the control animals until day 3 (panel D).

References

    1. Anderson AW, Xie J, Pizzonia J, Bronen RA, Spencer DD, Gore JC. Effects of cell volume fraction changes on apparent diffusion in human cells. Magnetic Resonance Imaging. 2000;18:689–95. - PubMed
    1. Atuegwu NC, Gore JC, Yankeelov TE. The integration of quantitative multi-modality imaging data into mathematical models of tumors. Physics in Medicine and Biology. 2010;55:2429–49. - PMC - PubMed
    1. Byrne HM. In: Cancer modelling and simulation. Preziosi L, editor. 2003. pp. 75–120.
    1. Chenevert TL, McKeever PE, Ross BD. Monitoring early response of experimental brain tumors to therapy using diffusion magnetic resonance imaging. Clin Cancer Res. 1997;3:1457–66. - PubMed
    1. Chenevert TL, Stegman LD, Taylor JM, Robertson PL, Greenberg HS, Rehemtulla A, Ross BD. Diffusion magnetic resonance imaging: an early surrogate marker of therapeutic efficacy in brain tumors. J Natl Cancer Inst. 2000;92:2029–36. - PubMed

Publication types