. 2012 Jan;122(1):408-18.
doi: 10.1172/JCI58753. Epub 2011 Dec 12.

In vitro modeling of the microvascular occlusion and thrombosis that occur in hematologic diseases using microfluidic technology

Affiliations

In vitro modeling of the microvascular occlusion and thrombosis that occur in hematologic diseases using microfluidic technology

Michelle Tsai et al. J Clin Invest. 2012 Jan.

Abstract

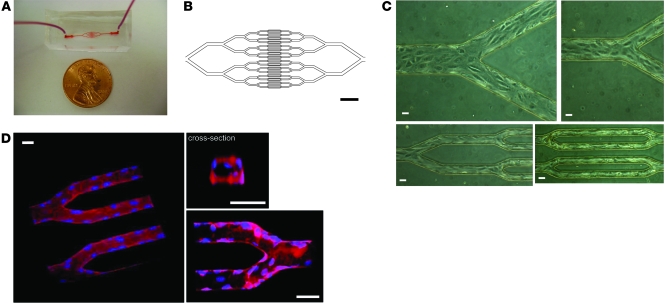
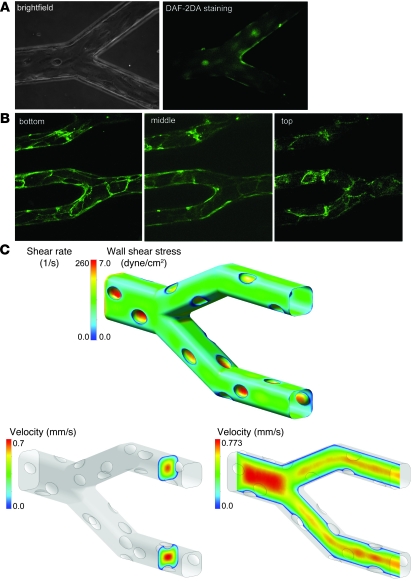
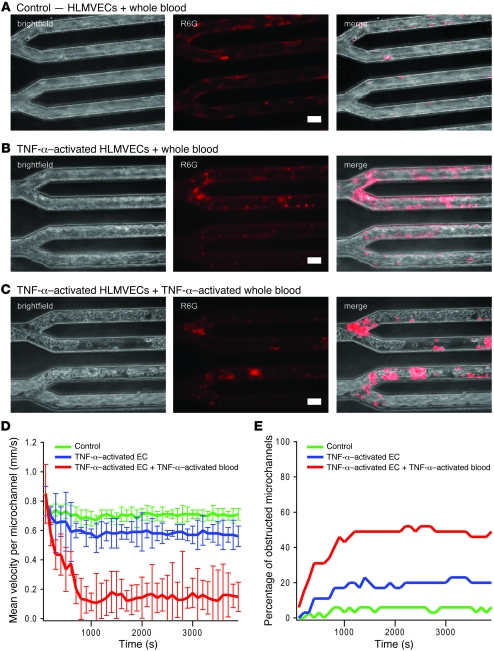
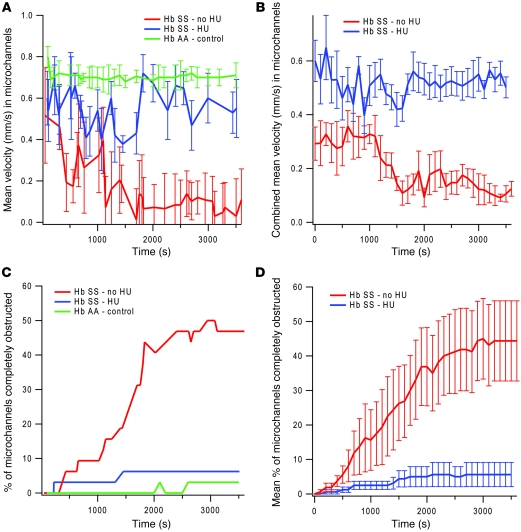
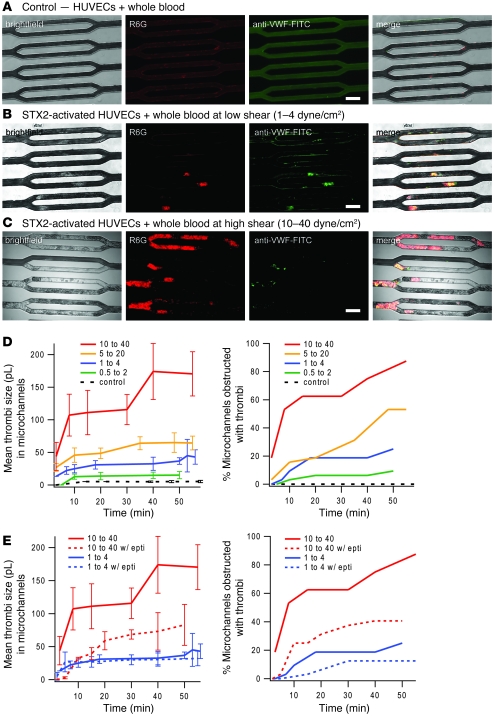
In hematologic diseases, such as sickle cell disease (SCD) and hemolytic uremic syndrome (HUS), pathological biophysical interactions among blood cells, endothelial cells, and soluble factors lead to microvascular occlusion and thrombosis. Here, we report an in vitro "endothelialized" microfluidic microvasculature model that recapitulates and integrates this ensemble of pathophysiological processes. Under controlled flow conditions, the model enabled quantitative investigation of how biophysical alterations in hematologic disease collectively lead to microvascular occlusion and thrombosis. Using blood samples from patients with SCD, we investigated how the drug hydroxyurea quantitatively affects microvascular obstruction in SCD, an unresolved issue pivotal to understanding its clinical efficacy in such patients. In addition, we demonstrated that our microsystem can function as an in vitro model of HUS and showed that shear stress influences microvascular thrombosis/obstruction and the efficacy of the drug eptifibatide, which decreases platelet aggregation, in the context of HUS. These experiments establish the versatility and clinical relevance of our microvasculature-on-a-chip model as a biophysical assay of hematologic pathophysiology as well as a drug discovery platform.


Figures

Figure 1
Figure 1. An in vitro microfluidic model of the microvasculature for investigating disease processes involving biophysical cellular interactions.
(A) Macroscopic view of PDMS microdevice. (B) Software-generated image used to develop the photolithography mask that defines the geometric pattern of the microfluidic channels. Smallest channels in this pattern are 30 μm wide. Scale bar: 600 μm. (C) Brightfield images show that within 48 hours, HUVECs seeded into the microdevice are cultured to confluency. Images are taken from different areas of the same device at the same scale. Scale bars: 30 μm. (D) 3D renderings of multiple confocal microscopy using fluorescent cell membrane (red) and cell nuclear (blue) dyes show that the endothelial cells line the entire inner surface of the microfluidic channels. The cross-sectional view also reveals that the cells round off the square corners of the smallest microchannels. Scale bars: 30 μm.
Figure 2
Figure 2. Characterization of the “endothelialized” microvasculature on a chip.
(A) Epifluorescence microscopy (with corresponding brightfield image) shows that HUVECs cultured in the microfluidic device stain positively with DAF-2DA, providing evidence that the endothelial cells are functional and appropriately produce NO. (B) Endothelial cell junctions also appropriately stain positive for anti–VE-cadherin–FITC. (C) Computational fluid dynamic modeling revealed that at centerline flow velocities and viscosities representative of physiologic microvascular conditions, flow was highly organized and that wall shear stress/shear rate levels were at physiological levels. For this particular simulation, the centerline velocity was adjusted to be 0.7 mm/s and viscosity was specified at 2.7 cP, corresponding to in vivo conditions in postcapillary venules of approximately 30 μm in diameter.
Figure 3
Figure 3. Decreased flow and microchannel occlusion due to activation with the inflammatory cytokine TNF-α.
(A) Brightfield imaging and epifluorescence using R6G, a fluorescent dye that preferentially stains leukocytes and platelets, revealed that when whole blood is flowed into the microdevice cultured with HLMVECs at postcapillary venular flow conditions, flow is steady overall, with occasional rolling but few adherent leukocytes. (B) When endothelial cells were activated with TNF-α before whole blood was flowed into the system, brightfield and R6G staining revealed a slight decrease in overall flow velocity, with occasional microchannel obstructions as well as an increase in adherent leukocytes. (C) TNF-α activation of both the endothelial cells and whole blood revealed a dramatic increase in microchannel obstruction, with subsequent decrease in overall flow likely due to a combination of increased adhesion and cell stiffness. Scale bars: 30 μm. (D) The addition of 0.5 μm fluorescent beads mixed into the whole blood samples enabled velocity quantification in each microchannel. The centerline bead velocity was measured for each channel and averaged for each data point. Compared with the control condition (no TNF-α activation), the average centerline velocity per microchannel (n = 32 microchannels/device) was significantly decreased when endothelial cells were preactivated with TNF-α (P < 0.05) and even more so when both endothelial cells and whole blood were preincubated with TNF-α (P < 0.005). Error bars show SD. (E) The percentage of microchannels completely obstructed due to aggregates of leukocytes increased with TNF-α of endothelial cells and increased even further with TNF-α activation of both the endothelial cells and whole blood.
Figure 4
Figure 4. Application of the microvasculature on a chip to vasoocclusion in SCD.
(A) Under identical initial hemodynamic conditions comparable to postcapillary venules using a microdevice cultured with HLMVECs, the microchannel velocity (n = 32 microchannels/device) of a whole blood sample taken from a healthy volunteer was compared with that of a whole blood sample taken from an SCD patient treated with HU and a whole blood sample from an SCD patient not treated with HU. Flow patterns of both sickle cell samples were much less steady than that of the control sample, and velocities of the sickle cell samples were lower than that of the control. Within 20 minutes of the start of the experiment until the end of the experiment, the velocity of the sickle cell HU sample was consistently lower than that of the sickle cell HU+ sample (P < 0.03). (B) These differences became more apparent when the average of velocity curves of blood samples taken from 5 different HU+ sickle cell blood samples were compared with the average of velocity curves of 5 different HU sickle cell blood samples (P < 0.008). (C) Similarly, a sickle cell HU whole blood sample exhibited a higher rate of microchannel obstruction than a sickle cell HU+ whole blood sample, and microchannel obstruction in the HU sample was even higher when compared with that of a healthy control. (D) Again, the differences became more apparent when the average of 5 obstruction curves from different HU+ sickle cell blood samples was compared with the average of 5 HU sickle cell blood samples (P < 0.032). All SCD patients in this study had hemoglobin SS (Hb SS), whereas health controls had hemoglobin AA (Hb AA). All error bars represent SD.
Figure 5
Figure 5. The microvasculature on a chip as an in vitro model for HUS.
(ac) HUVECs cultured to confluence in the microdevice were exposed to 30 pM STX2, a toxin that causes the hematologic manifestations of typical HUS, for 20 to 24 hours, and then whole blood containing STX2, R6G, and anti–vWF-FITC was flowed into the system at initial low shear (1–4 dyne/cm2) and high shear stresses (10–40 dyne/cm2). Compared with the control conditions (A), in which neither the endothelial cells nor whole blood was exposed to STX2, STX2 exposure led to the formation of thrombi consisting of leukocytes, platelets, and vWF, which occluded microchannels. This effect was more prominent at high shear (C) than low shear (B). (D) Multiple experiments using the same concentrations of STX2 were conducted at varying initial shear stress values. Thrombi volume (n = 32 microchannels/device), as measured using multiple confocal microscopy planes, and the percentage of microchannel occlusion due to STX2 exposure were shown to be shear dependent. (E) The addition of eptifibatide, a glycoprotein IIb/IIIa antagonist that inhibits platelet aggregation, in whole blood attenuated STX2-induced thrombi formation and microchannel obstruction. Interestingly, this effect was more pronounced at higher shear. All error bars represent SD. Scale bars: 80 μm.

Similar articles

Cited by

References

    1. Ballas SK, Mohandas N. Sickle red cell microrheology and sickle blood rheology. Microcirculation. 2004;11(2):209–225. - PubMed
    1. Bunn HF. Pathogenesis and treatment of sickle cell disease. N Engl J Med. 1997;337(11):762–769. doi: 10.1056/NEJM199709113371107. - DOI - PubMed
    1. Moake JL. Thrombotic microangiopathies. N Engl J Med. 2002;347(8):589–600. doi: 10.1056/NEJMra020528. - DOI - PubMed
    1. Lipowsky HH. Microvascular rheology and hemodynamics. Microcirculation. 2005;12(1):5–15. doi: 10.1080/10739680590894966. - DOI - PubMed
    1. Barabino GA, Platt MO, Kaul DK. Sickle cell biomechanics. Annu Rev Biomed Eng. 2010;12:345–367. doi: 10.1146/annurev-bioeng-070909-105339. - DOI - PubMed

Publication types

MeSH terms