. 2011 Dec 1;25(23):2465-79.
doi: 10.1101/gad.180331.111.

Macrophages and cathepsin proteases blunt chemotherapeutic response in breast cancer

Affiliations

Macrophages and cathepsin proteases blunt chemotherapeutic response in breast cancer

Tanaya Shree et al. Genes Dev. .

Abstract

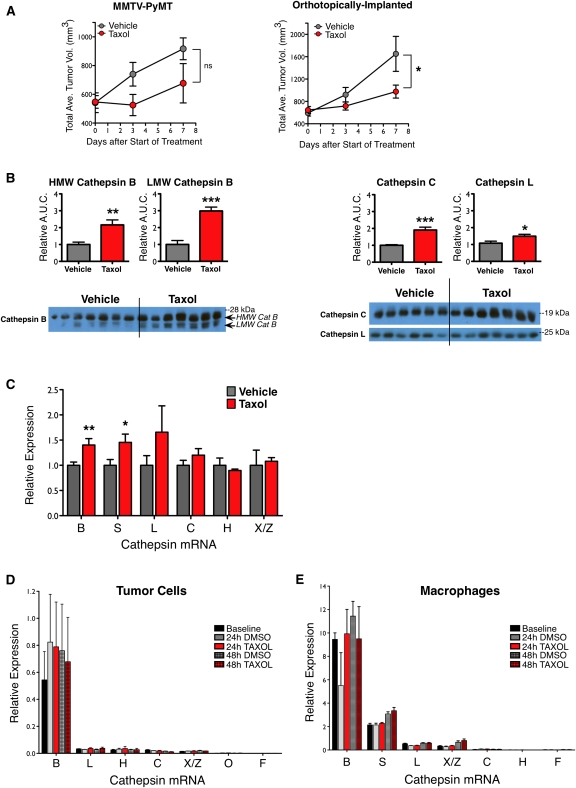
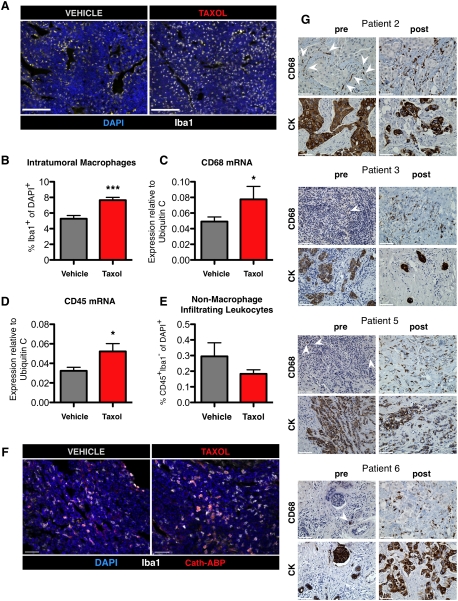
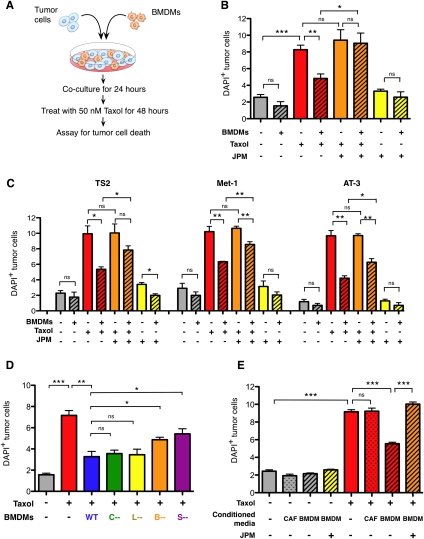
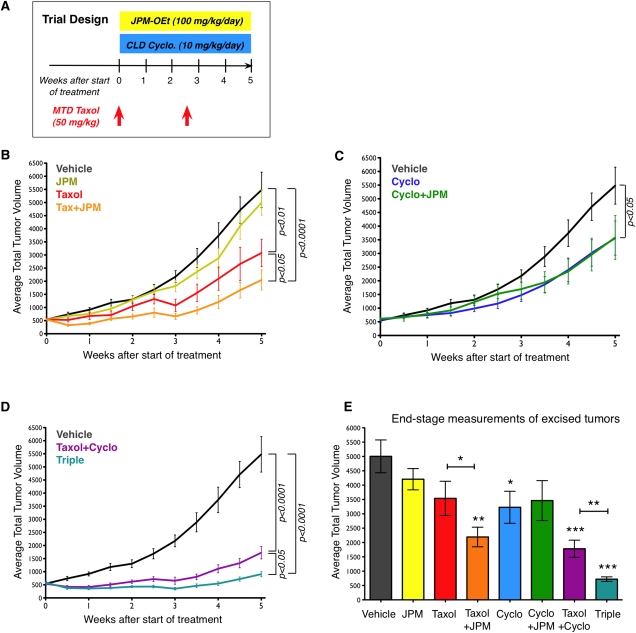
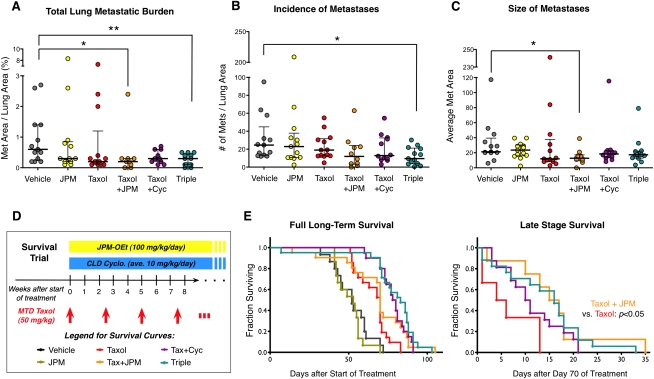
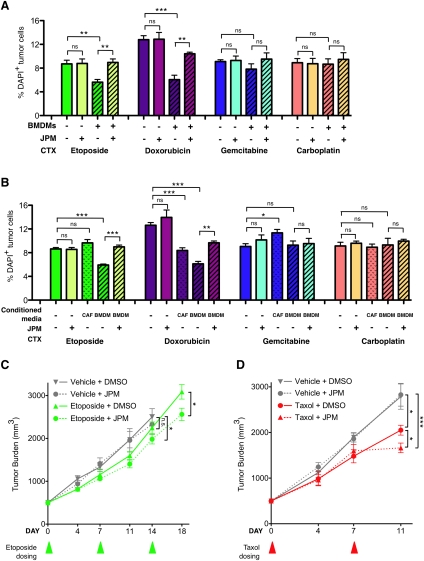
The microenvironment is known to critically modulate tumor progression, yet its role in regulating treatment response is poorly understood. Here we found increased macrophage infiltration and cathepsin protease levels in mammary tumors following paclitaxel (Taxol) chemotherapy. Cathepsin-expressing macrophages protected against Taxol-induced tumor cell death in coculture, an effect fully reversed by cathepsin inhibition and mediated partially by cathepsins B and S. Macrophages were also found to protect against tumor cell death induced by additional chemotherapeutics, specifically etoposide and doxorubicin. Combining Taxol with cathepsin inhibition in vivo significantly enhanced efficacy against primary and metastatic tumors, supporting the therapeutic relevance of this effect. Additionally incorporating continuous low-dose cyclophosphamide dramatically impaired tumor growth and metastasis and improved survival. This study highlights the importance of integrated targeting of the tumor and its microenvironment and implicates macrophages and cathepsins in blunting chemotherapeutic response.


Figures

Figure 1.
Figure 1.
Cathepsin levels in mammary tumors increase following Taxol treatment. (A) Tumor volume curves for PyMT transgenic mice (left) and orthotopically implanted mice (right) treated with one dose of either vehicle or Taxol (50 mg/kg) on day 0, as described in the Materials and Methods. n = 16–17 for PyMT mice; n = 5–8 for orthotopic model of TS1 PyMT cell line; (*) P < 0.05; (ns) not significant. (B) Taxol increased cathepsin levels at the tumor site. Implanted tumors were harvested from mice 7 d after vehicle or Taxol treatment, and whole-tumor lysates were assayed for cathepsin proteins. Quantitation of high-molecular-weight (HMW) and lower-molecular-weight (LMW) active cathepsin B (left) and cathepsin C and cathepsin L (right) are shown above the corresponding Western blots. Quantitation of the loading control actin is in Supplemental Figure S2. n = 6–7 mice per group; (*) P < 0.05; (**) P < 0.01; (***) P < 0.0001. (C) Cathepsin transcripts also increased after Taxol treatment. qRT–PCR analysis for cathepsin genes in lysates from implanted tumors, relative to an endogenous control gene, Ubiquitin C, and normalized to vehicle. n = 7–8 mice per group; (*) P < 0.05, (**) P < 0.01 by the Mann-Whitney test. (D,E) qRT–PCR analysis of cathepsin transcripts in tumor cells (D) or macrophages (E) in culture following treatment with DMSO control or Taxol showed that expression does not change significantly. n = 3 independent experiments in each case.
Figure 2.
Figure 2.
Chemotherapy induces a specific increase in macrophage infiltration in breast tumors. (A) Macrophages accumulate in tumors after Taxol treatment. Representative images of orthotopic tumors stained for the macrophage marker Iba1 7 d after vehicle or Taxol treatment. Bars, 100 μm. (B) Quantitation of intratumoral Iba1+ cells in tumors of vehicle- and Taxol-treated mice via image analysis. n = 12 vehicle, 9 Taxol; (***) P < 0.0001. All data in B–F are from whole tumors isolated 7 d after vehicle or Taxol treatment. (C,D) qRT–PCR from whole-tumor lysates for transcripts of CD68 (macrophages) and CD45 (all leukocytes) 7 d after vehicle or Taxol treatment (n = 7–8 tumors); (*) P < 0.05. (E) Quantitation by image analysis of the percentage of CD45+Iba1 cells of total DAPI+ cells in tumors after treatment with vehicle or Taxol (n = 6 mice per group). (F) Representative images of tumor sections from mice injected with the cathepsin ABP after vehicle or Taxol treatment and costained with the macrophage marker Iba1. (G) Macrophage numbers increase in breast cancer patients following neoadjuvant chemotherapy. Representative images of matched samples pre- and post-treatment from patients 2, 3, 5, and 6 stained with CD68 or a pan-cytokeratin (CK) antibody to visualize tumor cells. Positively stained cells are labeled in brown. Rare CD68+ cells in the pretreatment biopsies are indicated by white arrowheads. Patient information can be found in Supplemental Table S1. Bars: F,G, 50 μm.
Figure 3.
Figure 3.
Macrophage-supplied cathepsins protect tumor cells from cell death. (A) Schematic of coculture assay. (B) Percentage of DAPI+ (dead) tumor cells in mono- or coculture of the TS1 cell line with wild-type (WT) BMDMs 48 h after Taxol (50 nM) or DMSO treatment. Addition of the cathepsin inhibitor JPM (10 μM) abrogated the protective effect of BMDMs following Taxol treatment. (C) BMDMs also protected from Taxol-induced cell death in additional PyMT-derived tumor cell lines, TS2, Met-1, and AT-3, with experimental conditions as in B. (D) Percentage of TS1 tumor cell death in monoculture and in cocultures with wild-type or cathepsin B-, cathepsin S-, cathepsin C-, or cathepsin L-null BMDMs 48 h after treatment. Deletion of cathepsin B or cathepsin S significantly reduced macrophage-conferred protection. (E) Macrophage-conferred protection is largely contact-independent. Cell death in TS1 tumor cells cultured alone or in the presence of wild-type BMDM-CM or CAF-CM 48 h after treatment with Taxol or DMSO control. Addition of JPM (10 μM) to the CM abrogated the BMDM-conferred protection. For all graphs, data are from three independent experiments, each done in triplicate. (*) P < 0.05; (**) P < 0.01; (***) P < 0.001; (ns) not significant.
Figure 4.
Figure 4.
Cathepsin inhibition sensitizes tumors to Taxol treatment. (A) Trial schematic showing dosing of MTD Taxol, JPM, and CLD Cyclo in the 5-wk regression trial (from 9–14 wk of age). (B) Tumor volume curves for PyMT transgenic mice treated with Taxol, JPM, and Taxol+JPM, compared with vehicle, based on twice-weekly external palpation caliper measurements. n = 17 vehicle, 16 JPM, 16 Taxol, 16 Taxol+JPM. P-values in B–D derive from area-under-the-curve (AUC) analyses, with pairwise comparisons between indicated groups, although some of these effects did not reach statistical significance when adjusted for multiple comparisons. (C) Tumor volume curves for Cyclo- and Cyclo+JPM-treated mice compared with vehicle-treated mice. n = 14 Cyclo, 14 Cyclo+JPM. (D) Tumor volume curves for Taxol+Cyclo- and Triple-treated mice compared with vehicle-treated mice. n = 16 Taxol+Cyclo, 16 Triple. (E) End-stage tumor volumes based on measurements of excised tumors. (*) P < 0.05, (**) P < 0.01, (***) P < 0.0001, unpaired t-tests. Comparisons are with the vehicle group unless otherwise indicated. n = 14–15 per treatment group.
Figure 5.
Figure 5.
Combination treatments reduce lung metastasis and increase survival. (A) Total lung metastasis burden for indicated treatment groups, as determined by the percentage of total lung area covered by metastases for each mouse. Each data point in the scatter plots represents the mean value for an individual animal; horizontal lines represent the median with the interquartile range. (*) P < 0.05, (**) P < 0.01, Mann-Whitney test; n = 13 vehicle, 13 JPM, 13 Taxol, 10 Taxol+JPM, 12 Taxol+Cyclo, 13 Triple. (B) Graph showing the number of metastases per mouse per unit area. (C) Graph showing the average size (area in square microns) of metastatic lesions. (D) Survival trial schematic showing dosing of MTD Taxol, JPM, and CLD Cyclo. (E, left) Kaplan-Meier long-term survival curves of mice in the treatment groups indicated. Late-stage survival data beginning at the 70th day of treatment with only mice alive on that day are shown at the right. n = 15–21 per treatment group. P-values from log-rank test comparisons of survival data can be found in Supplemental Table S4.
Figure 6.
Figure 6.
Cathepsin-mediated chemoprotection is relevant to other chemotherapies and additional in vivo models. (A) Percentage of DAPI+ (dead) tumor cells in mono- or coculture of the TS1 cell line with BMDMs 48 h after etoposide (20 μM), doxorubicin (300 nM), gemcitabine (400 nM), carboplatin (50 μM), or DMSO treatment. Coculture with BMDMs was protective against treatment with etoposide and doxorubicin, but not gemcitabine or carboplatin. As with Taxol, the protective effect observed in BMDM coculture was significantly abrogated by the cathepsin inhibitor JPM (10 μM). (B) Cell death in tumor cells cultured alone or in the presence of wild-type (WT) BMDM-CM or CAF-CM 48 h after treatment with etoposide, doxorubicin, gemcitabine, carboplatin, or DMSO control. For all graphs in A and B, data are from three independent experiments, each performed in triplicate. (*) P < 0.05; (**) P < 0.01; (***) P < 0.001; (ns) not significant. (C) FVB/n mice orthotopically implanted with TS1 cells were treated with etoposide (10 mg/kg per week). Addition of JPM (100 mg/kg per day) significantly improved response to etoposide. (*) P < 0.05. The etoposide/JPM combination treatment also significantly reduced tumor growth compared with the vehicle-treated group on day 14 (endpoint for the vehicle- and JPM-treated mice due to tumor burden limits). n = 8–10 mice per group. (D) Athy/Nu mice orthotopically implanted with MDA-231 cells were treated with MTD Taxol (25mg/kg per week) or vehicle control. Addition of JPM (100 mg/kg per day) significantly improved response to Taxol in this preclinical xenograft model. (*) P < 0.05 compared with Taxol alone; (***) P < 0.001 compared with vehicle; n = 9–12 mice per group. Triangles below the graphs in C and D indicate the time points at which etoposide and Taxol, respectively, were administered.

Comment in

Similar articles

Cited by

References

    1. Abboud-Jarrous G, Atzmon R, Peretz T, Palermo C, Gadea BB, Joyce JA, Vlodavsky I 2008. Cathepsin L is responsible for processing and activation of proheparanase through multiple cleavages of a linker segment. J Biol Chem 283: 18167–18176 - PMC - PubMed
    1. Ahn GO, Tseng D, Liao CH, Dorie MJ, Czechowicz A, Brown JM 2010. Inhibition of Mac-1 (CD11b/CD18) enhances tumor response to radiation by reducing myeloid cell recruitment. Proc Natl Acad Sci 107: 8363–8368 - PMC - PubMed
    1. Bell-McGuinn KM, Garfall AL, Bogyo M, Hanahan D, Joyce JA 2007. Inhibition of cysteine cathepsin protease activity enhances chemotherapy regimens by decreasing tumor growth and invasiveness in a mouse model of multistage cancer. Cancer Res 67: 7378–7385 - PubMed
    1. Blansfield JA, Caragacianu D, Alexander HR III, Tangrea MA, Morita SY, Lorang D, Schafer P, Muller G, Stirling D, Royal RE, et al. 2008. Combining agents that target the tumor microenvironment improves the efficacy of anticancer therapy. Clin Cancer Res 14: 270–280 - PubMed
    1. Bogyo M, Verhelst S, Bellingard-Dubouchaud V, Toba S, Greenbaum D 2000. Selective targeting of lysosomal cysteine proteases with radiolabeled electrophilic substrate analogs. Chem Biol 7: 27–38 - PubMed

Publication types

MeSH terms

LinkOut - more resources