. 2012 Feb;86(4):2132-42.
doi: 10.1128/JVI.06898-11. Epub 2011 Dec 7.

Natural killer cells regulate murine cytomegalovirus-induced sialadenitis and salivary gland disease

Affiliations

Natural killer cells regulate murine cytomegalovirus-induced sialadenitis and salivary gland disease

Virginia A Carroll et al. J Virol. 2012 Feb.

Abstract

The transmission of herpesviruses depends on viral shedding at mucosal surfaces. The salivary gland represents a major site of persistent viral replication for many viruses, including cytomegalovirus. We established a mouse model of salivary gland dysfunction after acute viral infection and investigated the cellular requirements for the loss of secretion. Murine cytomegalovirus (MCMV) infection severely impaired saliva secretion independently of salivary gland virus levels. Lymphocytes or circulating monocytes/macrophages were not required for secretory dysfunction. Dysfunction occurred before glandular inflammation, suggesting that a soluble mediator initiated the disruption of acinar cell function. Despite genetic differences in innate resistance to MCMV, NK cells protected the host against acinar atrophy and the loss of secretions under conditions of an exceedingly low virus inoculum. NK cells also modulated the type of glandular inflammation after infection, as they prevented an influx of Siglec-F(+) polymorphonuclear leukocytes (PMNs). Therefore, beyond their recognized role in controlling MCMV replication, NK cells preserve organ integrity and function and regulate the innate inflammatory response within the gland.


Figures
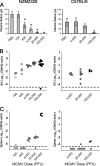
Fig 1
Fig 1
MCMV infectious-dose-dependent impairment of SG function in lupus- and non-lupus-prone mice. (A) Mean saliva volumes ± standard errors of the means (SEM) for NZM and B6 mice (3 to 8 mice per group) at day 7 after infection with the indicated SGV dose. (*, P < 0.05 compared to the PBS control.) (B and C) MCMV genome values determined by qPCR for SG (B) and spleen (C) tissues of individual NZM and B6 mice. The qPCR detection limit (dashed line) is indicated.
Fig 2
Fig 2
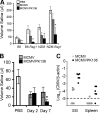
MCMV infection and viral replication are required to impair normal SG function. (A) Mean saliva volumes ± SEM collected in 12 min for two groups of B6 mice examined before (day 0) and then after the injection of 105 PFU live or UV-inactivated SGV at the indicated times. (*, P < 0.05 compared to uninfected controls, determined by a paired Student t test; mean saliva volumes were not significantly different after injection of UV-MCMV.) (B) Mean saliva volumes ± SEM collected in 12 min for control and NK cell-depleted (PK136) B6 mice examined at the indicated times before and then after infection with TC-derived MCMV (5 × 10⁴ PFU). (*, P < 0.05 compared to uninfected controls, determined by a paired Student t test, and compared to NK-depleted controls, determined by an unpaired Student t test.)
Fig 3
Fig 3
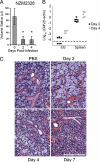
Secretory dysfunction occurs before high-level viral burden and inflammation are established in SG tissue. (A) Mean saliva volumes ± SEM for groups of NZM mice at the indicated times after infection with 105 PFU. Data are representative of 2 experiments with 5 to 8 mice per treatment group. (*, P < 0.05 compared to PBS controls.) (B) MCMV genome qPCR values for SG and spleen tissues from NZM mice at the indicated times after infection. (C) H&E-stained sections of SMG of NZM mice (magnification, ×200). White scale bar, 200 μm. Images are representative of 4 to 5 mice per group. Acini appeared enlarged and foamy at day 2 but were free of inflammatory cells. Infiltrating leukocytes were found near blood vessels around the ducts at day 4. Acini in these areas appeared atrophic. Atrophic acini were more evident with the severe infiltration of mixed leukocytes at day 7.
Fig 4
Fig 4
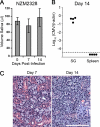
Normal SG function is maintained after low-dose viral infection despite high-level MCMV infection in the gland. (A) Mean saliva volumes ± SEM for the same cohort of NZM mice (4 to 6 mice per group), measured at days 7 and 14 after low-dose infection with 100 PFU MCMV. (B) MCMV genome qPCR values for SG and spleen tissues from NZM mice at day 14 after low-dose infection. (C) H&E-stained sections of SMG from NZM mice at the indicated times after infection (magnification, ×200). White scale bar, 200 μm. Images are representative of 4 mice per group.
Fig 5
Fig 5
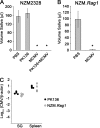
MCMV-induced SG dysfunction is lymphocyte independent. (A and B) Mean saliva volumes ± SEM for control and NK cell-depleted (PK136) NZM (A) and NZM.Rag1 (B) mice (4 to 5 mice per group) at day 7 after infection with 105 PFU MCMV. (*, P < 0.05 compared with the control and PK136 alone, determined by a Student t test). (C) MCMV genome qPCR values for SG and spleen from NK cell-depleted NZM and NZM.Rag1−/− mice at day 7 after infection.
Fig 6
Fig 6
MCMV-induced inflammatory monocyte recruitment to SG is CCR2 independent and not essential for SG dysfunction. (A) On day 2 post-MCMV infection (2 × 10⁵ PFU), SG leukocytes from B6 and B6.CCR2−/− mice were stained for CD45, Ly6C, and CD11b and analyzed by flow cytometry. Representative dot plots show the proportion of inflammatory monocytes (CD11b+ Ly6Chi). The dot plots were gated on live CD45+ cells. Panels are representative of pooled glands (3 to 5) from at least 2 independent experiments. (B) NZM mice were treated with PBS or clodronate liposomes before infection (105 PFU). On day 2 after infection, control (PBS) and MCMV-infected SG leukocytes from NZM mice were stained for CD45, Ly6C, and CD11b and analyzed by flow cytometry. Representative dot plots show the proportions of inflammatory monocytes (CD11b+ Ly6Chi) in control and clodronate-treated SG. The dot plots were gated on live CD45+ cells. Panels are representative of pooled glands (4 glands) from at least 2 independent experiments. (C) Mean saliva volumes ± SEM for B6 and B6.CCR2−/− mice for uninfected controls and at day 2 after MCMV (2 × 10⁵ PFU) infection. (*, P < 0.05 compared to the PBS control.) (D) MCMV genome qPCR values for SG and spleen from B6 and B6.CCR2−/− mice at day 2 after infection. (E) Mean saliva volumes ± SEM for the indicated groups of NZM mice measured at day 2 after infection. Data are representative of 2 experiments with 4 to 11 mice per treatment group. (*, P < 0.05 compared to the control and clodronate-alone [Clod] groups.) (F) MCMV genome qPCR values for SG and spleen from NZM mice at day 2 after infection. (*, P < 0.05 compared with the control, determined by a Student t test.)
Fig 7
Fig 7
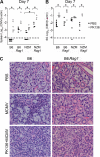
NK cells control viral burden and SG immunopathology after low-dose MCMV infection. (A and B) MCMV genome qPCR values for spleen (A) and SG (B) tissues of control and NK cell-depleted B6 and B6.Rag1 (female) and NZM and NZM.Rag1 (male) mice at day 7 after low-dose MCMV infection (B6 mice, 4,000 PFU; NZM mice, 100 PFU). The qPCR detection limit (dashed line) is indicated. (*, P < 0.05 by one-way ANOVA with Tukey's multiple-comparison test.) (C) NK cells protect against widespread acinar atrophy and inflammation after infection. Shown are H&E-stained SMG sections from B6 and B6.Rag1 mice of the indicated treatment groups (magnification, ×400). Images are representative of 3 to 5 mice per group.
Fig 8
Fig 8
NK cells maintain normal SG function after low-dose MCMV infection. (A) Mean saliva volumes ± SEM for B6 and B6.Rag1 (female) and NZM and NZM.Rag1 (male) mice measured at day 7 after low-dose MCMV infection (B6 mice, 4,000 PFU; NZM mice, 100 PFU). Data are representative of 2 experiments with 6 to 8 animals per group (B6 and NZM mice) and one experiment with 3 to 6 animals per group (B6.Rag1 and NZM.Rag1 mice). (*, P < 0.05 compared to controls.) (B and C) Control and NK cell-depleted B6 mice were infected with a low dose of only 100 PFU MCMV. (B) Mean saliva volumes ± SEM measured at the indicated times after infection in the same cohort of B6 mice. Data are representative of 2 experiments with 5 to 7 mice per treatment group. (*, P < 0.05 compared to controls.) (C) MCMV genome qPCR values for SG and spleen tissues at day 7.

Similar articles

Cited by

References

    1. Basu D, Williams FM, Ahn CW, Reveille JD. 2006. Changing spectrum of the diffuse infiltrative lymphocytosis syndrome. Arthritis Rheum. 55:466–472 - PubMed
    1. Boring L, et al. 1997. Impaired monocyte migration and reduced type 1 (Th1) cytokine responses in C-C chemokine receptor 2 knockout mice. J. Clin. Invest. 100:2552–2561 - PMC - PubMed
    1. Brown MG, et al. 2001. Vital involvement of a natural killer cell activation receptor in resistance to viral infection. Science 292:934–937 - PubMed
    1. Bukowski JF, Woda BA, Welsh RM. 1984. Pathogenesis of murine cytomegalovirus infection in natural killer cell-depleted mice. J. Virol. 52:119–128 - PMC - PubMed
    1. Cavanaugh VJ, Deng Y, Birkenbach MP, Slater JS, Campbell AE. 2003. Vigorous innate and virus-specific cytotoxic T-lymphocyte responses to murine cytomegalovirus in the submaxillary salivary gland. J. Virol. 77:1703–1717 - PMC - PubMed

Publication types

MeSH terms