. 2012 Mar;14(3):315-25.
doi: 10.1093/neuonc/nor209. Epub 2011 Dec 12.

Reduced phosphocholine and hyperpolarized lactate provide magnetic resonance biomarkers of PI3K/Akt/mTOR inhibition in glioblastoma

Affiliations

Reduced phosphocholine and hyperpolarized lactate provide magnetic resonance biomarkers of PI3K/Akt/mTOR inhibition in glioblastoma

Humsa S Venkatesh et al. Neuro Oncol. 2012 Mar.

Abstract

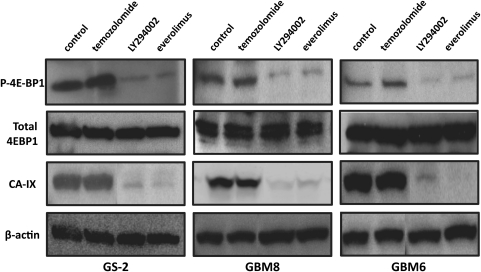
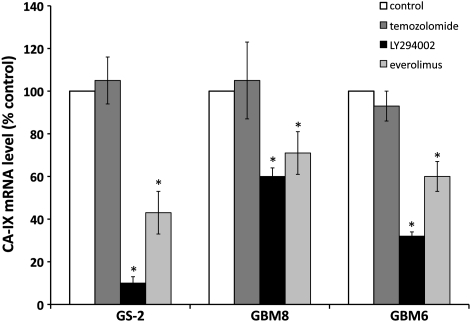
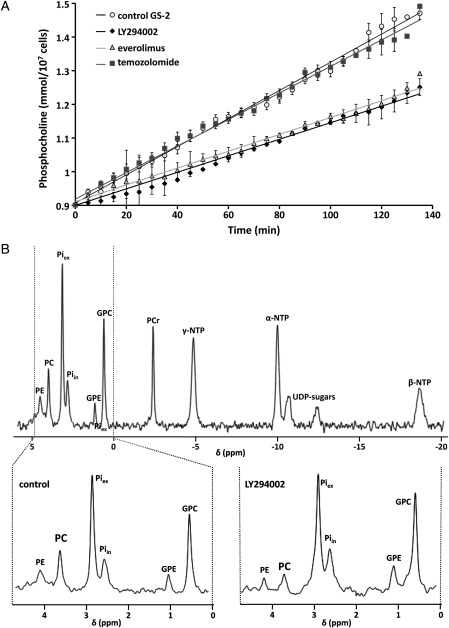
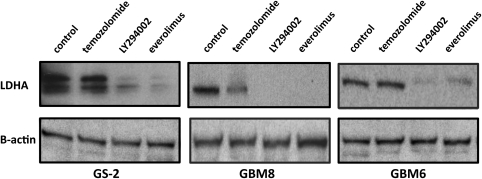
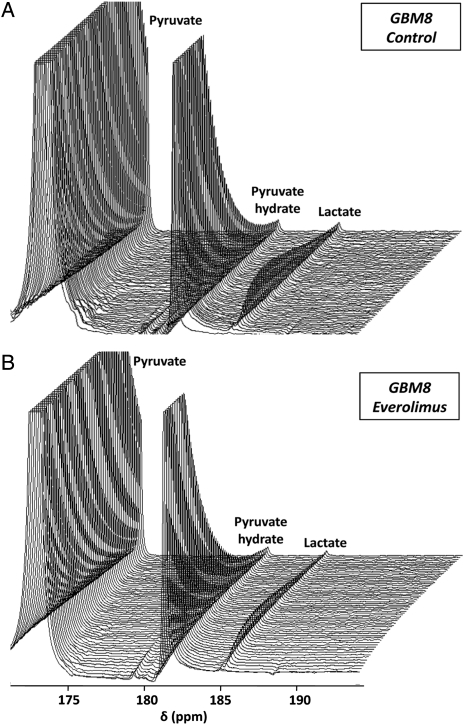
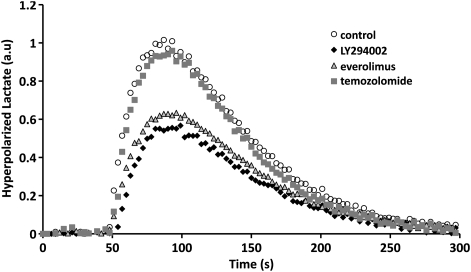
The phosphatidylinositol-3-kinase/Akt/mammalian target of rapamycin (PI3K/Akt/mTOR) signaling pathway is activated in more than88% of glioblastomas (GBM). New drugs targeting this pathway are currently in clinical trials. However, noninvasive assessment of treatment response remains challenging. By using magnetic resonance spectroscopy (MRS), PI3K/Akt/mTOR pathway inhibition was monitored in 3 GBM cell lines (GS-2, GBM8, and GBM6; each with a distinct pathway activating mutation) through the measurement of 2 mechanistically linked MR biomarkers: phosphocholine (PC) and hyperpolarized lactate.(31)P MRS studies showed that treatment with the PI3K inhibitor LY294002 induced significant decreases in PC to 34 %± 9% of control in GS-2 cells, 48% ± 5% in GBM8, and 45% ± 4% in GBM6. The mTOR inhibitor everolimus also induced a significant decrease in PC to 62% ± 14%, 57% ± 1%, and 58% ± 1% in GS-2, GBM8, and GBM6 cells, respectively. Using hyperpolarized (13)C MRS, we demonstrated that hyperpolarized lactate levels were significantly decreased following PI3K/Akt/mTOR pathway inhibition in all 3 cell lines to 51% ± 10%, 62% ± 3%, and 58% ± 2% of control with LY294002 and 72% ± 3%, 61% ± 2%, and 66% ± 3% of control with everolimus in GS-2, GBM8, and GBM6 cells, respectively. These effects were mediated by decreases in the activity and expression of choline kinase α and lactate dehydrogenase, which respectively control PC and lactate production downstream of HIF-1. Treatment with the DNA damaging agent temozolomide did not have an effect on either biomarker in any cell line. This study highlights the potential of PC and hyperpolarized lactate as noninvasive MR biomarkers of response to targeted inhibitors in GBM.


Figures

Fig. 1.
Fig. 1.
Western blot analysis of P-4EBP1, total-4EBP1, and CA-IX in GS-2, GBM6, and GBM8 cell lines treated with temozolomide, LY294002, and everolimus. In all 3 cell lines, P-4EBP1 and CA-IX protein levels were lower following treatment with everolimus and LY294002, confirming the inhibition in signaling downstream of mTOR and HIF-1α, respectively. Total-4EBP1 levels were not affected by any treatment in any cell line. Temozolomide had no effects on protein levels in all 3 cell lines. β-actin was used as a loading control.
Fig. 2.
Fig. 2.
RT-PCR analysis of GS-2, GBM8, and GBM6 cell lines treated with temozolomide, LY294002, and everolimus. CA-IX mRNA expression was significantly decreased following LY294002 treatment in each cell line: 10% ± 2% of control in GS-2 (P = 2 × 10⁻⁴), 61% ± 22% in GBM8 (P = 4 × 10⁻²), and 33% ± 8% in GBM6 (P = 5 × 10⁻³). Everolimus treatment also induced a significant decrease in CA-IX mRNA expression in all cell lines: 43% ± 10% of control in GS-2 (P = 1 × 10⁻²), 71% ± 10% in GBM8 (P = 4 × 10⁻²), and 60% ± 7% in GBM6 (P = 1 × 10⁻²). Temozolomide had no effect on CA-IX mRNA expression in any cell line. These results confirm the inhibition of HIF-1 transcriptional activity following PI3K/Akt/mTOR pathway inhibition. *P ≤ .05.
Fig. 3.
Fig. 3.
(A) PC level as measured by 1H MRS in cell lysates as a function of time for control GS-2 cells and GS-2 cells treated with LY294002, everolimus, and temozolomide ( 3 repeats per treatment). The rate of PC production was 8.4 ± 0.2 fmol/cell/h in GS-2 control cells, whereas PC production decreased in LY294002 and everolimus-treated cells to 4.7 ± 0.4 fmol/cell/h and 5.0 ± 1.0 fmol/cell/h, respectively. Temozolomide treatment had no effect on the rate of PC production (7.7 ± 0.2 fmol/cell/h). (B) 31P MR spectrum of perfused control GS-2 cells. Abbreviations: top row; PE, phosphoethanolamine; PC, phosphocholine; Piex, extracellular inorganic phosphate; Piint, intracellular inorganic phosphate; GPE, glycerophosphoethanolamine; GPC, glycerophosphocholine; PCr, phosphocreatine; γ-NTP, γ nucleotide triphosphates; UDP sugars, uracil-diphosphate sugars; β-NTP, β nucleotides triphosphates. Zoom on the 0–5 ppm region of 31P MR spectra of GS-2 controls (left) and LY294002-treated (right) GS-2 cells. PC levels decrreased following inhibition of PI3K by LY294002 (1.33 ± 0.32 fmol/cell in controls vs. 0.45 ± 0.33 fmol/cell in LY294002 treated GS-2 cells), in line with the observed drop in ChoK activity (A).
Fig. 4.
Fig. 4.
Western blot analysis of LDHA in GS-2, GBM8, and GBM6 cell lines treated with temozolomide, LY294002, and everolimus. In all 3 cell lines, LDHA protein levels were lower following treatment with everolimus and LY294002, in line with the reduced transcriptional activity of HIF-1. Temozolomide had no effects on LDHA protein levels in all 3 cell lines. β-actin was used as a loading control.
Fig. 5.
Fig. 5.
Stack plots of hyperpolarized 13C MR spectra acquired after injection of exogenous hyperpolarized pyruvate in perfused GBM8 control cells (A) and cells treated for 48 h with everolimus (B). The resonances of pyruvate (173 ppm), pyruvate hydrate (181 ppm), and lactate (185 ppm) can be seen for both control and treated cells, but the hyperpolarized lactate production is reduced in cells treated with everolimus.
Fig. 6.
Fig. 6.
Hyperpolarized lactate intensity as a function of time as assessed from HP 13C MR spectra of control, temozolomide-treated, everolimus-treated, and LY294002-treated perfused GS-2 cells. Both LY294002 and everolimus induced a significant decrease in the maximum intensity of hyperpolarized lactate. Temozolomide treatment had no effect on hyperpolarized lactate production.

Similar articles

Cited by

References

    1. CBRTUS. Statistical report - Primary brain and central nervous system tumors diagnosed in the United states in 2004–2006. 2010. http://seer.cancer.gov/ - PMC - PubMed
    1. Clarke J, Butowski N, Chang S. Recent advances in therapy for glioblastoma. Arch Neurol. 2010;67(3):279–283. doi:10.1001/archneurol.2010.5. - DOI - PubMed
    1. Furnari FB, Fenton T, Bachoo RM, et al. Malignant astrocytic glioma: genetics, biology, and paths to treatment. Genes Dev. 2007;21(21):2683–2710. doi:10.1101/gad.1596707. - DOI - PubMed
    1. Grzmil M, Hemmings BA. Deregulated signalling networks in human brain tumours. Biochim Biophys Acta. 2010;1804(3):476–483. - PubMed
    1. Comprehensive genomic characterization defines human glioblastoma genes and core pathways. Nature. 2008;455(7216):1061–1068. doi:10.1038/nature07385. - DOI - PMC - PubMed

Publication types

MeSH terms