Comparative Study
. 2012 Mar 15;21(6):1336-49.
doi: 10.1093/hmg/ddr572. Epub 2011 Dec 8.

Variants in ASB10 are associated with open-angle glaucoma

Affiliations
Comparative Study

Variants in ASB10 are associated with open-angle glaucoma

Francesca Pasutto et al. Hum Mol Genet. .

Abstract

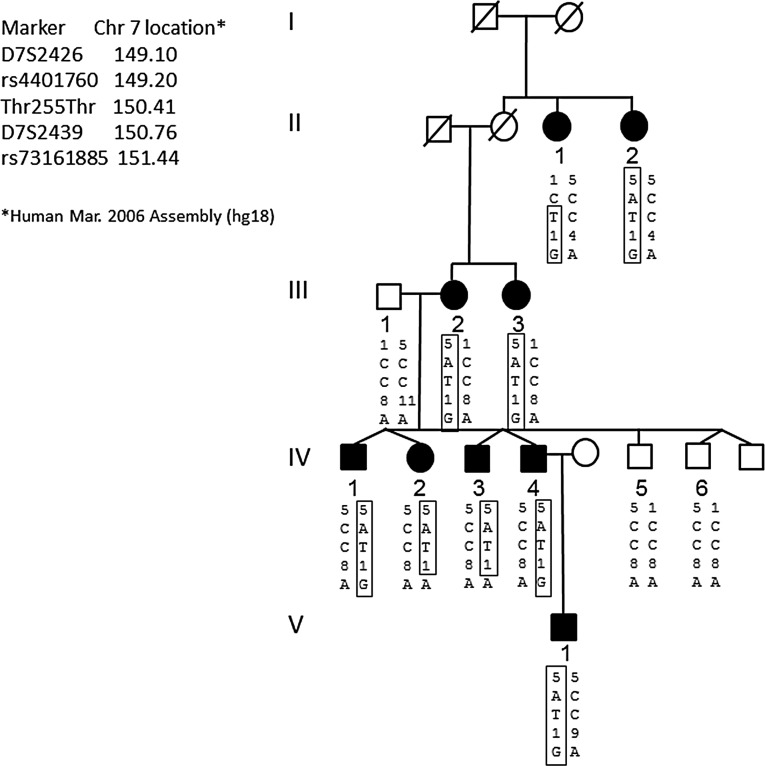
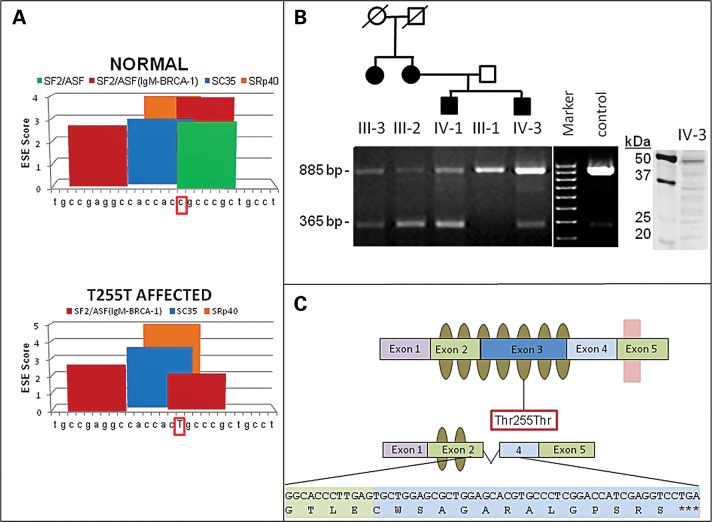
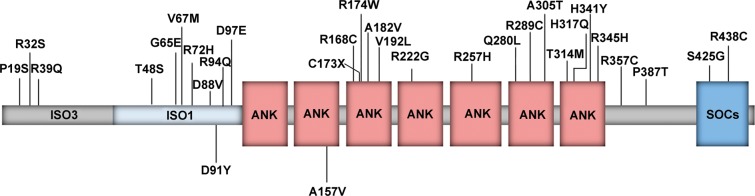
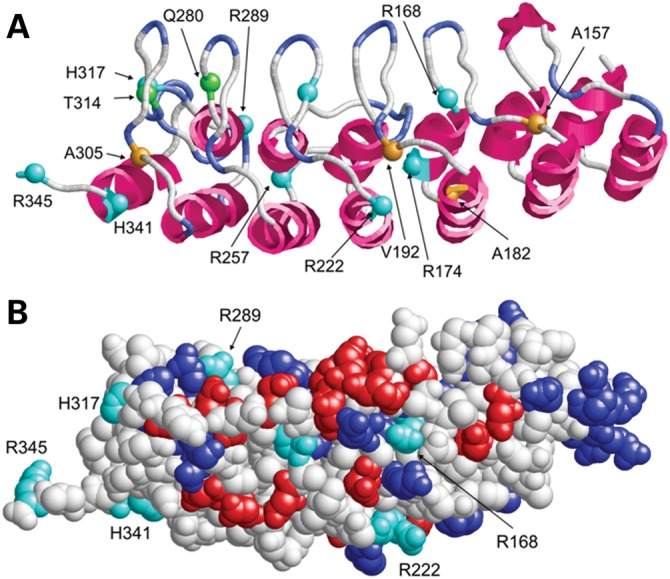
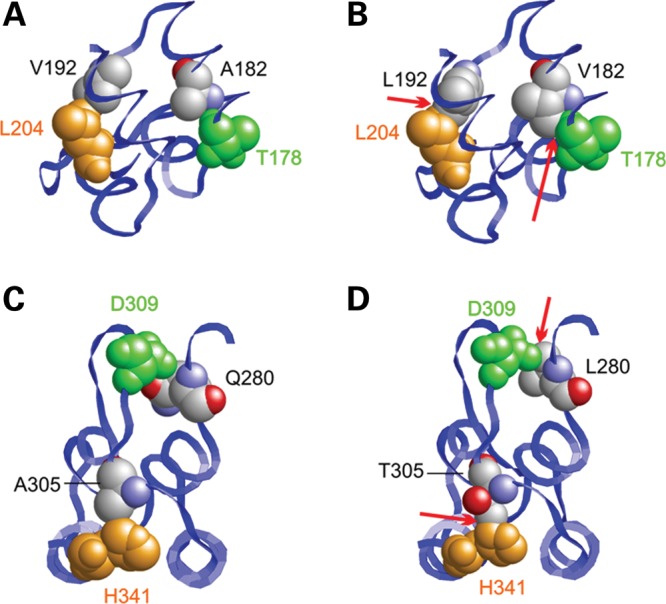
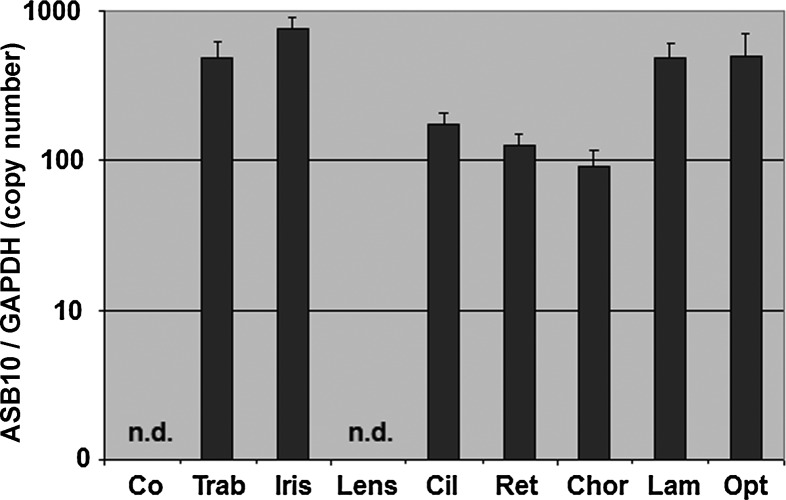
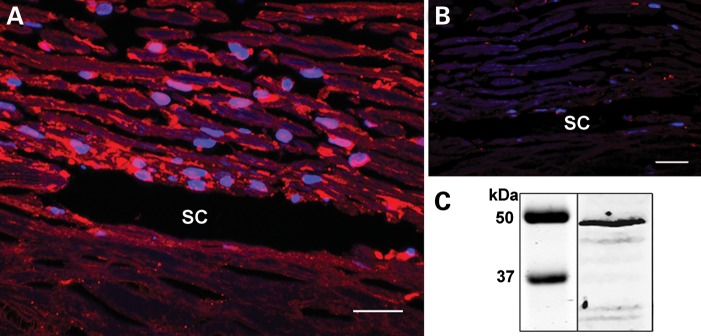
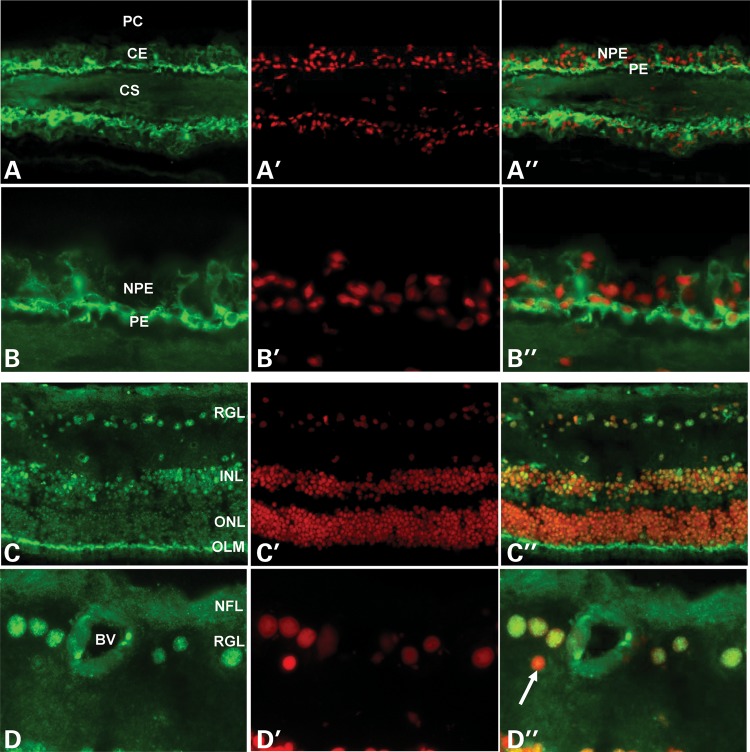
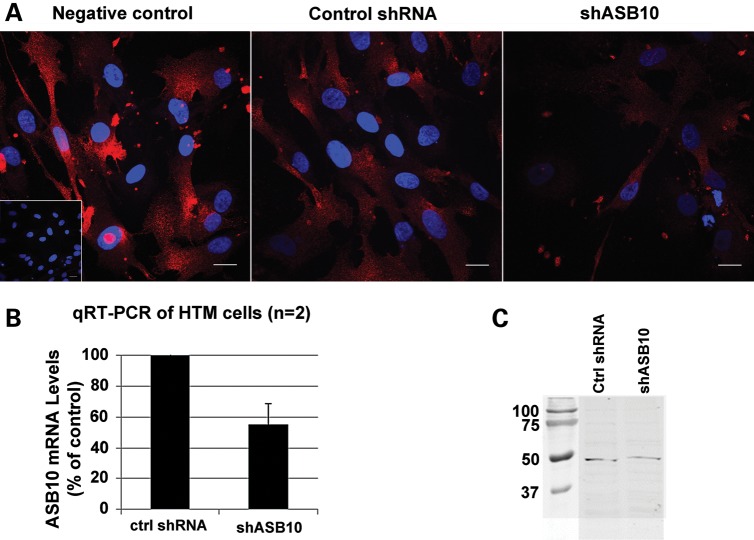
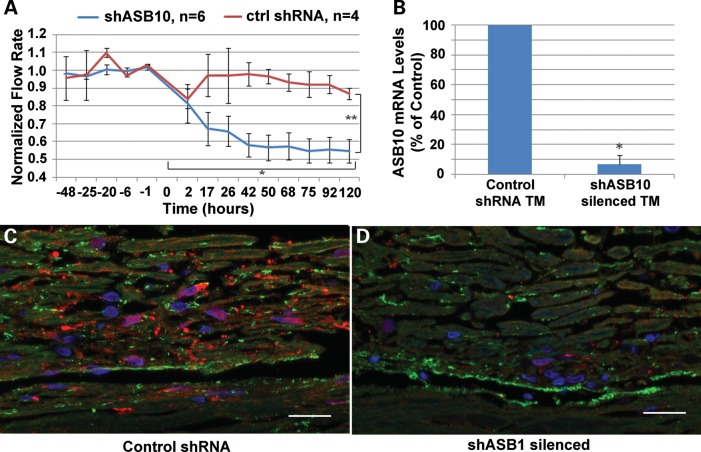
The molecular events responsible for obstruction of aqueous humor outflow and the loss of retinal ganglion cells in glaucoma, one of the main causes of blindness worldwide, remain poorly understood. We identified a synonymous variant, c.765C>T (Thr255Thr), in ankyrin repeats and suppressor of cytokine signaling box-containing protein 10 (ASB10) in a large family with primary open angle glaucoma (POAG) mapping to the GLC1F locus. This variant affects an exon splice enhancer site and alters mRNA splicing in lymphoblasts of affected family members. Systematic sequence analysis in two POAG patient groups (195 US and 977 German) and their respective controls (85 and 376) lead to the identification of 26 amino acid changes in 70 patients (70 of 1172; 6.0%) compared with 9 in 13 controls (13 of 461; 2.8%; P = 0.008). Molecular modeling suggests that these missense variants change ASB10 net charge or destabilize ankyrin repeats. ASB10 mRNA and protein were found to be strongly expressed in trabecular meshwork, retinal ganglion cells and ciliary body. Silencing of ASB10 transcripts in perfused anterior segment organ culture reduced outflow facility by ∼50% compared with control-infected anterior segments (P = 0.02). In conclusion, genetic and molecular analyses provide evidence for ASB10 as a glaucoma-causing gene.


Figures

Figure 1.
Figure 1.
Pedigree analysis of the GLC1F family and disease haplotype. Black symbols denote patients with POAG, and white symbols denote unaffected or unknown status. Genotypes are listed in the order given by the map to the left. The haplotype of the disease chromosome is boxed. Both SNPs that determined the linkage interval (rs4401760 in II-1 and rs73161885 in IV-2 and IV-3) are also shown. The synonymous mutation in ASB10 found in the family is indicated by Thr255Thr (c.765C>T). Note that the T allele of Thr255Thr segregates with the disease haplotype.
Figure 2.
Figure 2.
Predicted model of ASB10 alternative splicing, ESE sites and splicing in transformed lymphocytes from POAG patients and controls. (A) Graphical representation of in silico ESE finder analysis. Using the normal ASB10 sequence surrounding the synonymous Thr255Thr change, a number of different splice enhancer binding sites are predicted. When the synonymous change (c.765C>T) (surrounded by red box) is introduced, the splice enhancer SF2/ASF site is lost (green bar, lower panel) and the scores of other ESEs are altered. The nucleotides that were analyzed with ESE finder correspond to nucleotides 860–886 of ASB10 cDNA (NM_080871.3). (B) RT-PCR on transformed lymphocyte RNA from four affected GLC1F family members, the unaffected father of two of them and an unrelated control (Cnt) using primers located in exons 2 and 4 of ASB10. In all individuals, a PCR product of 885 bp (exons 2–4) is present, whereas an additional product of 365 bp (exons 2–4) is detected in affected individuals. The identity of the affected individuals and their position in the pedigree is indicated above the graph. This pedigree is a partial pedigree of the family shown in Figure 1. The agarose gel is representative of several different replicates performed. Western blot analysis of ASB10 protein from lymphoblasts from individual IV-3 is shown. A full-length band (48 kDa) and several smaller-molecular-weight bands are detected using the monoclonal V1 antibody. Molecular weight markers (kDa) are shown. (C) Schematic of the ASB10 protein. Ankyrin repeats are indicated by olive ovals. The SOCS box is indicated by a pink box overlapping exon 5. The position of the synonymous change (Thr255Thr) is indicated by a red box. The predicted coding sequence and protein structure when exon 3 is spliced out is also shown. This leads to a premature stop codon with the loss of five ankyrin repeats and the SOCS box.
Figure 3.
Figure 3.
ASB10 protein domain structure and location of non-synonymous variants identified in this study. Schematic representation of the protein domains highlighting the location of the 7 ankyrin-repeat domain (ANK) and the C-terminal SOCS box domain (SOCs). All amino acid changes identified in the patient cohorts are listed above; changes identified only in the control groups are listed below the structure.
Figure 4.
Figure 4.
Structure (A) and surface presentation (B) of the ankyrin-repeat region of ASB10 (comprising residues 100–345 of isoform 3). The ASB10 ankyrin repeat was modeled on the crystal structure of human AnkR. (A) Sequence position, for which mutations were found, are shown as balls and are labeled. Charged, polar and non-polar sites of mutation are colored cyan, green and orange, respectively. (B) Acidic and basic residues are colored in red and blue, respectively. Basic residues, which were found to be mutated in POAG patients, are shown in cyan and labeled. Note that the latter group of basic residues does not form salt bridges with acidic residues, suggesting that they play only a minor role for protein stability.
Figure 5.
Figure 5.
Mutations causing steric clashes in the ankyrin-repeat region. (AD) Effect of the Ala182Val, Val192Leu, Gln280Leu and Ala305Thr mutations. In the wild-type (A), Ala182 and Val192 form tight interactions with Thr178 and Leu204, respectively. In the wild-type (C), Gln280 and Ala305 form tight interactions with Asp309 and His341, respectively. The longer side chains present in all mutants (B, D) lead to clashes with the neighboring residues (marked by red arrows) potentially resulting in decreased protein stability.
Figure 6.
Figure 6.
Quantitative determination of ASB10 mRNA expression levels in human ocular tissues using RT-PCR technology (n = 4). The expression levels were normalized against GAPDH and the results are expressed as copy number ASB10/GAPDH. Co, cornea; Trab, trabecular meshwork; Cil, ciliary body; Ret, retina; Chor, choroid; Lam, lamina cribrosa; Opt, opticus, n.d., not detected.
Figure 7.
Figure 7.
Immunofluorescence of human TM tissue. (A) Human TM tissue showed ASB10 expression throughout the beams and in the juxtacanalicular region of the HTM. (B) A negative control using PBS instead of the primary antibody. SC, Schlemm's canal. (C) Western immunoblot analysis of ASB10 protein from cultured primary human TM cells. A band corresponding to the predicted size of full-length ASB10 was detected in RIPA cell lysates. All results shown are representative of HTM cells derived from three different individuals. Molecular weight markers are shown (kDa). Scale bar, 20 μm. DAPI labeled nuclei (blue).
Figure 8.
Figure 8.
Immunofluorescence of ASB10 protein in ciliary processes (A, B) and retina (C, D) of a normal human donor eye (age, 63 years). (A, B) Positive ASB10 immunostaining (green) is seen in the cytoplasm and perinuclear region of the pigmented ciliary epithelial layer. (C, D) Positive ASB10 immunostaining (green) can be localized to the nuclei (red) of retinal ganglion cells, individual neurons in the inner nuclear layer and to the outer limiting membrane. Smaller cell nuclei, probably belonging to retinal astrocytes, are negative (D′, arrow) (BV, blood vessel; CE, ciliary epithelium; CS, ciliary stroma; INL, inner nuclear layer; NFL, nerve fiber layer; NPE, non-pigmented ciliary epithelium; OLM, outer limiting membrane; ONL, outer nuclear layer; PC, posterior chamber; PE, pigmented ciliary epithelium; RGL, retinal ganglion cell layer; magnification: (A, C) ×100 in and (B, D) ×250.
Figure 9.
Figure 9.
ASB10 gene knockdown by shRNA lentivirus. (A) Immunofluorescence of HTM cells mock-infected (left) or infected with control shRNA lentivirus (center) or shASB10 lentivirus (right) using an ASB10 polyclonal antibody. DAPI stains the nucleus (blue). Inset shows a negative control with PBS instead of primary antibody. Scale bars, 20 µm. (B) qRT-PCR analysis of HTM cells infected with 106 pfus of shASB10 or control shRNA lentivirus. (C) Western analysis of ASB10 protein knockdown in HTM cells using the polyclonal antibody. HTM cells were infected with 106 pfus of shASB10 or control shRNA lentivirus for 6 days. Molecular weight markers are shown (kDa).
Figure 10.
Figure 10.
Effects of shASB10 on outflow facility in human anterior segment perfusion culture. (A) shASB10 or control shRNA lentivirus was applied to human anterior segments in perfusion culture at time point 0. The number of replicates is shown. Error bars represent the standard error of the mean. Outflow facility was measured for a further 5 days. *P = 0.002 flow rates just prior to application versus at 120 h as determined by a paired Student's t-test. **P = 0.01 control shRNA versus shASB10 by an unpaired Student's t-test. (B) qRT-PCR of ASB10 mRNA levels in TM tissue extracts after outflow experiments. ASB10 mRNA levels were reduced ∼95% in shASB10-infected TM (n = 5) when compared with control-infected TM (n = 3). *P = 0.02 as determined by an unpaired Students's t-test. (C, D) ASB10 immunostaining (red) of tissue post-silencing of control (C) and shASB10-infected (D) TM. Fibronectin (green) was used as a counter-stain in both images. Note that the confocal settings were identical for each image and the images were representative of five shASB10-infected eyes and three controls. DAPI was used to stain the nuclei blue. Scale bars, 20 µm.

References

    1. Quigley H.A. Glaucoma. Lancet. 2011;377:1367–1377. doi:10.1016/S0140-6736(10)61423-7. - DOI - PubMed
    1. Drance S.M., Sweeney V.P., Morgan R.W., Feldman F. Studies of factors involved in the production of low tension glaucoma. Arch. Ophthalmol. 1973;89:457–465. doi:10.1001/archopht.1973.01000040459003. - DOI - PubMed
    1. Goldwyn R., Waltman S.R., Becker B. Primary open-angle glaucoma in adolescents and young adults. Arch. Ophthalmol. 1970;84:579–582. doi:10.1001/archopht.1970.00990040581004. - DOI - PubMed
    1. Allingham R.R., Liu Y., Rhee D.J. The genetics of primary open-angle glaucoma: a review. Exp. Eye Res. 2009;88:837–844. doi:10.1016/j.exer.2008.11.003. - DOI - PMC - PubMed
    1. Fingert J.H., Robin A.L., Stone J.L., Roos B.R., Davis L.K., Scheetz T.E., Bennett S.R., Wassink T.H., Kwon Y.H., Alward W.L., et al. Copy number variations on chromosome 12q14 in patients with normal tension glaucoma. Hum. Mol. Genet. 2011;20:2482–2494. doi:10.1093/hmg/ddr123. - DOI - PMC - PubMed

Publication types

MeSH terms

Substances