Influence of prion variant and yeast strain variation on prion-molecular chaperone requirements
- PMID: 22156732
- PMCID: PMC4012409
- DOI: 10.4161/pri.17818
Influence of prion variant and yeast strain variation on prion-molecular chaperone requirements
Abstract
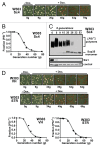
Prions of budding yeast serve as a tractable model of amyloid behavior. Here we address the issue of the effect of yeast strain variation on prion stability, focusing also on the effect of amyloid conformation and the involvement of the co-chaperone Sis1, an essential J-protein partner of Hsp70. We found, despite an initial report to the contrary, that yeast strain background has little effect on the requirement for particular Sis1 domains for stable propagation of the prion [RNQ+], if the level of Sis1 expression is controlled. On the other hand, some variation in prion behavior was observed between yeast strains, in particular, the stability of certain [PSI+] variants. Future examination of such yeast strain-specific phenomena may provide useful insights into the basis of prion/chaperone dynamics.
Figures


Similar articles
-
Hsp40 function in yeast prion propagation: Amyloid diversity necessitates chaperone functional complexity.Prion. 2015;9(2):80-9. doi: 10.1080/19336896.2015.1020268. Prion. 2015. PMID: 25738774 Free PMC article.
-
Impact of Amyloid Polymorphism on Prion-Chaperone Interactions in Yeast.Viruses. 2019 Apr 16;11(4):349. doi: 10.3390/v11040349. Viruses. 2019. PMID: 30995727 Free PMC article. Review.
-
Functional diversification of hsp40: distinct j-protein functional requirements for two prions allow for chaperone-dependent prion selection.PLoS Genet. 2014 Jul 24;10(7):e1004510. doi: 10.1371/journal.pgen.1004510. eCollection 2014 Jul. PLoS Genet. 2014. PMID: 25058638 Free PMC article.
-
Yeast J-protein Sis1 prevents prion toxicity by moderating depletion of prion protein.Genetics. 2021 Oct 2;219(2):iyab129. doi: 10.1093/genetics/iyab129. Genetics. 2021. PMID: 34849884 Free PMC article.
-
Differential effects of chaperones on yeast prions: CURrent view.Curr Genet. 2018 Apr;64(2):317-325. doi: 10.1007/s00294-017-0750-3. Epub 2017 Sep 20. Curr Genet. 2018. PMID: 28932898 Review.
Cited by
-
Hsp40 function in yeast prion propagation: Amyloid diversity necessitates chaperone functional complexity.Prion. 2015;9(2):80-9. doi: 10.1080/19336896.2015.1020268. Prion. 2015. PMID: 25738774 Free PMC article.
-
[PIN+]ing down the mechanism of prion appearance.FEMS Yeast Res. 2018 May 1;18(3):foy026. doi: 10.1093/femsyr/foy026. FEMS Yeast Res. 2018. PMID: 29718197 Free PMC article. Review.
-
Impact of Amyloid Polymorphism on Prion-Chaperone Interactions in Yeast.Viruses. 2019 Apr 16;11(4):349. doi: 10.3390/v11040349. Viruses. 2019. PMID: 30995727 Free PMC article. Review.
-
Determination of Growth-Phase Dependent Influences Exerted by Prions on Yeast Lipid Content Using HPTLC-Densitometry.Acta Chromatogr. 2016;28(3):373-385. doi: 10.1556/1326.2016.28.3.7. Epub 2015 Nov 2. Acta Chromatogr. 2016. PMID: 27974871 Free PMC article.
-
Chaperone functional specificity promotes yeast prion diversity.PLoS Pathog. 2018 Jan 4;14(1):e1006695. doi: 10.1371/journal.ppat.1006695. eCollection 2018 Jan. PLoS Pathog. 2018. PMID: 29300791 Free PMC article. No abstract available.
References
-
- Chiti F, Dobson CM. Protein misfolding, functional amyloid and human disease. Annu Rev Biochem. 2006;75:333–366. - PubMed
-
- Sondheimer N, Lindquist S. Rnq1: an epigenetic modifier of protein function in yeast. Mol Cell. 2000;5:163–172. - PubMed
-
- Derkatch IL, Bradley ME, Hong JY, Liebman SW. Prions affect the appearance of other prions: the story of [PIN(+)] Cell. 2001;106:171–182. - PubMed
-
- Wickner RB, Masison DC, Edskes HK. [PSI] and [URE3] as yeast prions. Yeast. 1995;11:1671–1685. - PubMed
Publication types
MeSH terms
Substances
Grants and funding
LinkOut - more resources
Full Text Sources
Molecular Biology Databases
