

Cerebrospinal fluid proteins predict longitudinal hippocampal degeneration in early-stage dementia of the Alzheimer type
- PMID: 22156755
- PMCID: PMC3309103
- DOI: 10.1097/WAD.0b013e31823c0cf4
Cerebrospinal fluid proteins predict longitudinal hippocampal degeneration in early-stage dementia of the Alzheimer type
Abstract
Objective: Biomarkers are needed to improve the sensitivity and accuracy of diagnosis, and also prognosis, in individuals with early Alzheimer disease (AD). Measures of brain structure and disease-related proteins in the cerebrospinal fluid (CSF) have been proposed as biomarkers, yet relatively little is known about the relationships between such measures. The present study was conducted to assess the relationship between CSF Aβ and tau protein levels and longitudinal measures of hippocampal structure in individuals with and without very mild dementia of the Alzheimer type.
Design: A single CSF sample and longitudinal magnetic resonance scans were collected. The CSF samples were assayed for tau, phosphorylated tau181 (p-tau181), Aβ1-42, and Aβ1-40 using an enzyme-linked immunosorbent assay. Large-deformation diffeomorphic metric mapping was used to generate hippocampal surfaces, and a composite hippocampal surface (previously constructed from 86 healthy participants) was used as a structural reference.
Patients or other participants: Thirteen participants with very mild AD (Clinical Dementia Rating, CDR 0.5) and 11 cognitively normal participants (CDR 0).
Intervention: None.
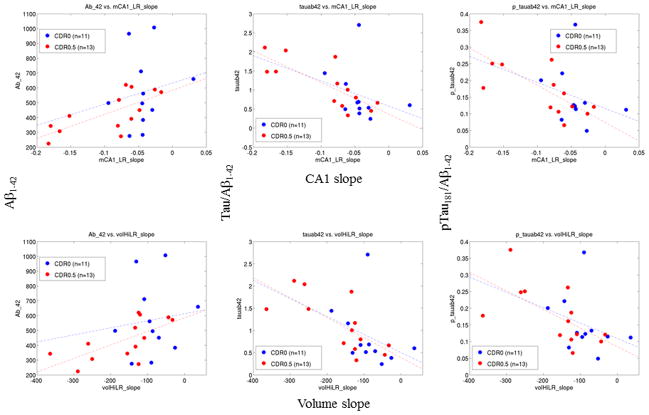
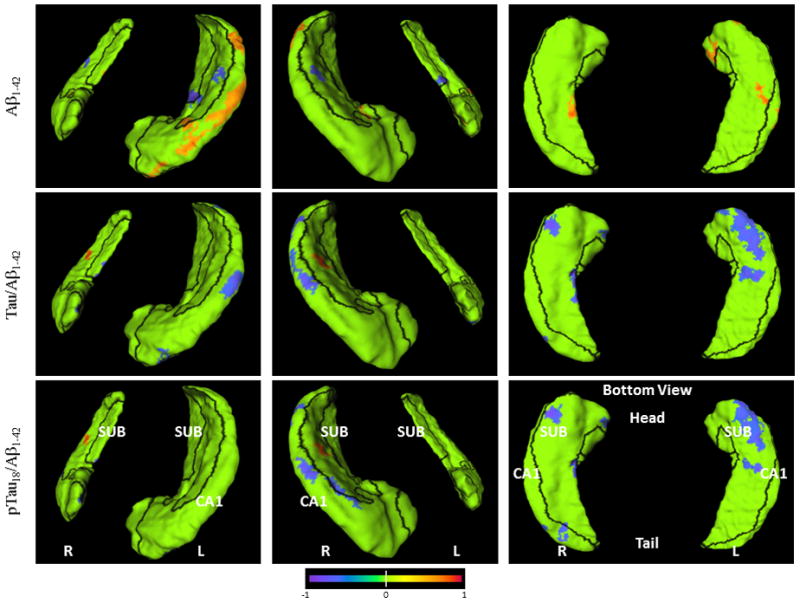
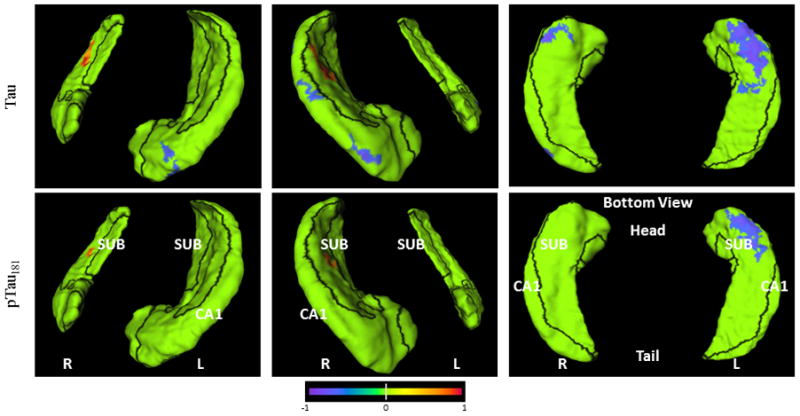
Main outcome measures: Initial and rate-of-change measures of total hippocampal volume and displacement of the hippocampal surface within zones overlying the CA1, subiculum, and CA2-4+DG cellular subfields, and their correlations with initial CSF measures.
Results: Lower CSF Αβ1-42 levels and higher tau/Αβ1-42 and p-tau181/Αβ1-42 ratios were strongly correlated with decreases in hippocampal volume and measures of progressive inward deformations of the CA1 subfield in participants with early AD, but not in cognitively normal participants.
Conclusions: Despite the small sample size, we found that Αβ1-42 related and tau-related CSF measures were associated with hippocampal degeneration in individuals with clinically diagnosed early AD and may reflect an association with a common underlying disease mechanism.
Figures
References
-
- Arnold SE, Hyman BT, Flory J, Damasio AR, Van Hoesen GW. The topographical and neuroanatomical distribution of neurofibrillary tangles and neuritic plaques in the cerebral cortex of patients with Alzheimer’s disease. Cereb Cortex. 1991;1(1):103–116. - PubMed
-
- Price JL, Morris JC. Tangles and plaques in nondemented aging and “preclinical” Alzheimer’s disease. Ann Neurol. 1999;45(3):358–368. - PubMed
-
- de Leon MJ, DeSanti S, Zinkowski R, et al. Longitudinal CSF and MRI biomarkers improve the diagnosis of mild cognitive impairment. Neurobiology of Aging. 2006;27(3):394–401. - PubMed
Publication types
MeSH terms
Substances
Grants and funding
LinkOut - more resources
Full Text Sources
Medical
Miscellaneous
